Hi Sindhu,
Follow these steps to create a donut chart:
1. Select the measure and dimension which you want to show the pie chart.
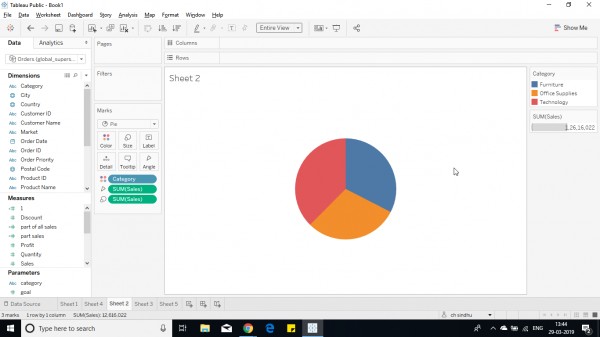
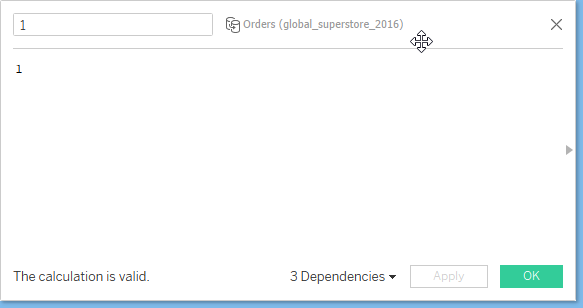
2. Now Create a calculated field like this.
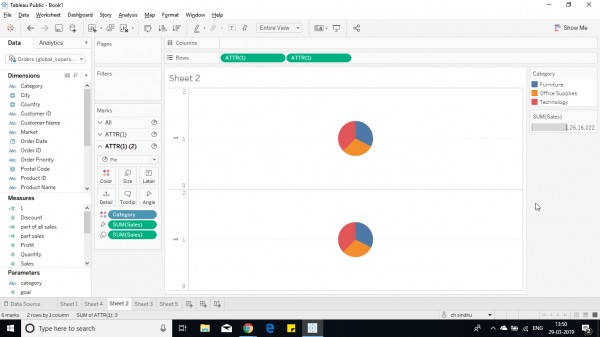
3. Now drag and drop the field in the row shelf.(make it attribute not sum(1) )
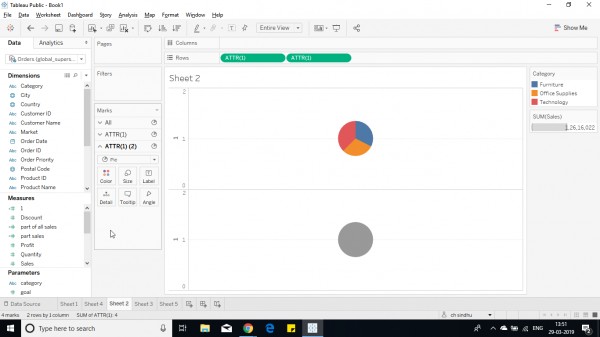
4. Now remove all measures from any shelves for 2nd row.
5. Now make dual axis in row shelf.
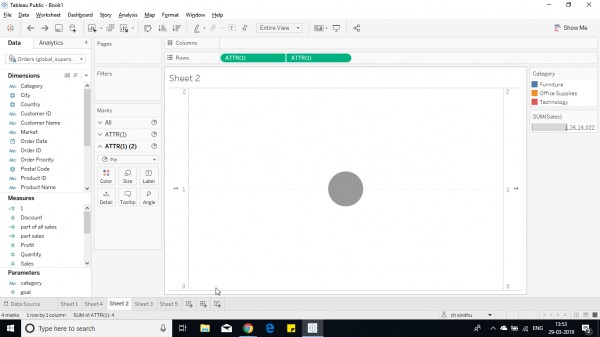
6. Now change the size in ATTR(1)(2) lower than before.
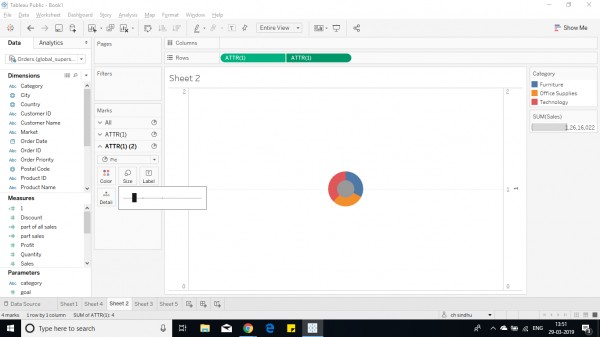
7. Change the color ATTR(1) (2) to white from color shelf.
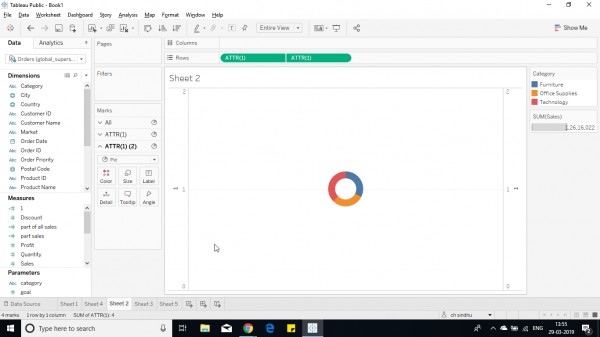
8.Now remove all headers,format and add required labels.
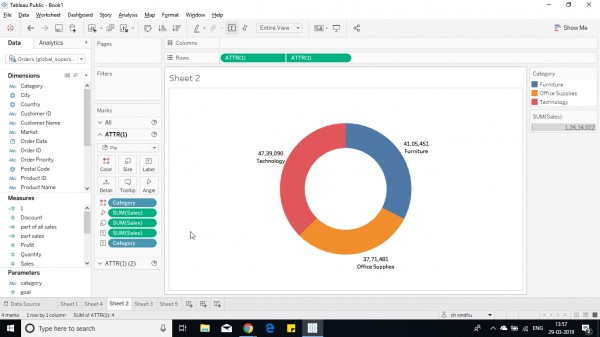
9. The donut chart is created.
Hope this helps you.
 REGISTER FOR FREE WEBINAR
X
 Thank you for registering
Join Edureka Meetup community for 100+ Free Webinars each month
JOIN MEETUP GROUP