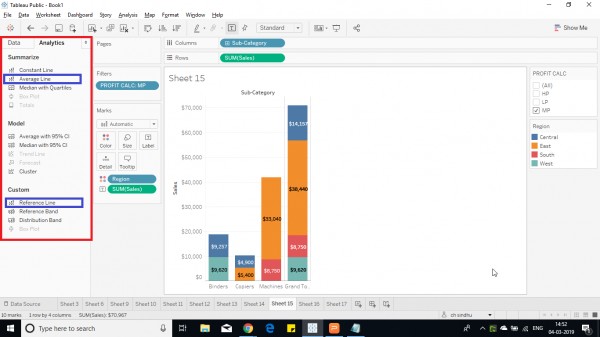
Hi, Once you created the bar chart (with or without grand totals). you can click on analysis tab on the left side of the screen.

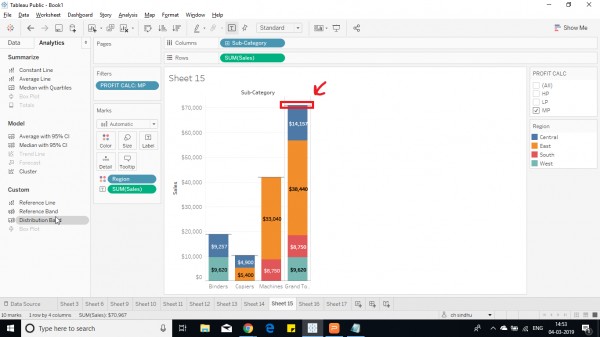
Drag either average line or reference line and drop on each cell pane. Then click on the line and click on edit option.

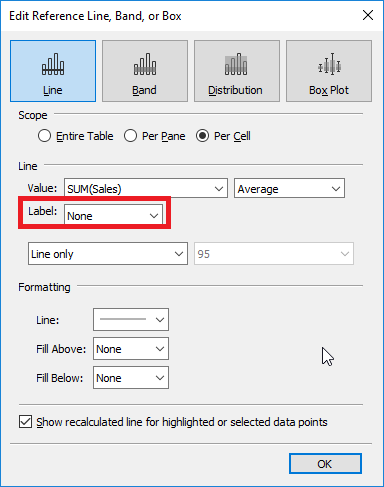
Then this window is shown. select the computation required then click on the drop down box near label, then click on custom.

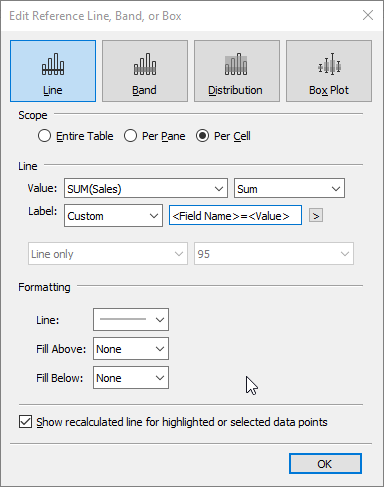
Then another box opens next to it. then click on the arrow button, it shows you options to add in the label. Fields used in the chart and extra text can also be displayed on the label such as text or symbols,etc.like <Field Name> = <Value> .

This way you can have custom fonts.
Hope this helps you.
 REGISTER FOR FREE WEBINAR
X
 Thank you for registering
Join Edureka Meetup community for 100+ Free Webinars each month
JOIN MEETUP GROUP