waterfall difference chart

0 votes
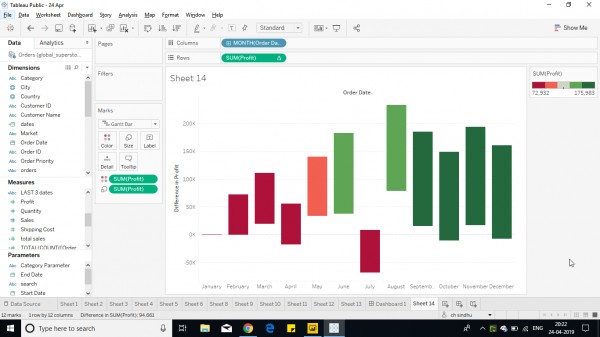
How to make a waterfall chart to show differences month wise for differences?
Apr 25, 2019 in Tableau by sindhu
455 views

1 answer to this question.

0 votes

Hi Sindhu,

Follow below steps:

1. Add sales and date field to the sheet.

2. Now Right click on sales field and add a quick calculation to difference.

3. Now Change Bar chart to Gantt chart by selecting under marks pane.

4. Add sales to the color shelf.

5. Edit the colors for the group and make it 2 steppes to observe the difference for decrease and increase for better visual.
Hope it helps you.

answered Apr 25, 2019 by Cherukuri
• 33,030 points

Related Questions In Tableau

0 votes
1 answer

Creating a stacked waterfall chart in tableau

You can try this as a solution: 1.) ...READ MORE

answered Apr 5, 2022 in Tableau by Vaani
• 7,020 points
1,058 views
0 votes
2 answers

How can I add text in the centre of a Donut Chart ?

Hi, You can read this for creating a donut ...READ MORE

answered Apr 4, 2019 in Tableau by Cherukuri
• 33,030 points
11,515 views
0 votes
1 answer

Creating a dual axis chart with same measure in Tableau

Yes, this is possible. Drop the measure in ...READ MORE

answered May 29, 2018 in Tableau by Atul
• 10,240 points
8,270 views
+1 vote
1 answer

Creating a Gantt Chart over time with summed bar

The trick with Gantt charts in Tableau ...READ MORE

answered Jul 21, 2018 in Tableau by Atul
• 10,240 points
690 views
0 votes
1 answer
0 votes
1 answer

Tableau chart with mixed colors

It is as simple as dragging the ...READ MORE

answered Jun 28, 2018 in Tableau by ffdfd
• 5,550 points
1,610 views
0 votes
1 answer

How to color code cells of a column based on the text value in Tableau

You can use the following steps to ...READ MORE

answered Mar 27, 2018 in Tableau by Atul
• 10,240 points
9,423 views
+2 votes
1 answer
0 votes
1 answer

How to create a waterfall chart in tableau?

Hi, Follow theses steps: 1. Select profit and order date ...READ MORE

answered Mar 26, 2019 in Tableau by Cherukuri
• 33,030 points
894 views
0 votes
1 answer

How to show % difference between bar chart to show increase or decrease?

Hi Anshuli, Make the bar chart first for ...READ MORE

answered Apr 5, 2019 in Tableau by Cherukuri
• 33,030 points
10,554 views
webinar REGISTER FOR FREE WEBINAR X
REGISTER NOW
webinar_success Thank you for registering Join Edureka Meetup community for 100+ Free Webinars each month JOIN MEETUP GROUP