Hi,
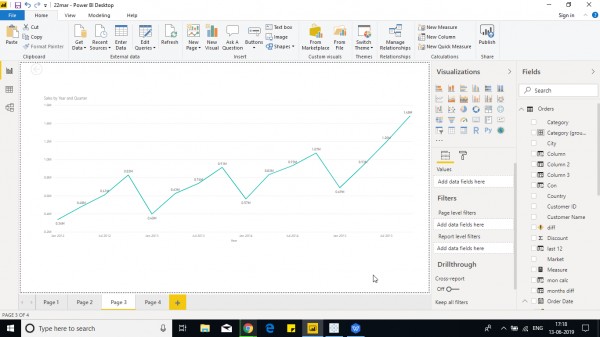
You can show a forecast for a single line across a chart. So you can create for categories each a chart to display the forecast.
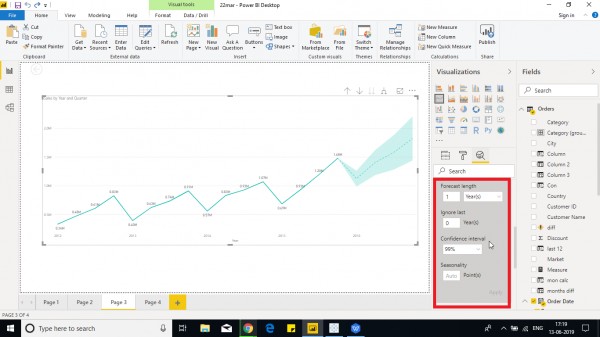
To show the forecast, Create a line chart then Go to Analytics Tab and Go to forecast.
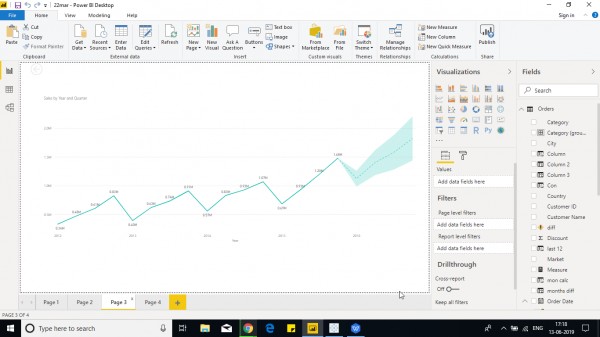
Now Add a forecast line and edit the parameters such as year/month wise, number of years, and the line characteristics such as line type, color, etc


So the forecast line is added.
 REGISTER FOR FREE WEBINAR
X
 Thank you for registering
Join Edureka Meetup community for 100+ Free Webinars each month
JOIN MEETUP GROUP