Clustering using R and Tableau

0 votes

Clustering using R and Tableau

Jun 19, 2019 in Tableau by cherukuri sindhu
1,412 views

1 answer to this question.

0 votes

Let me explain with a simple explanation of forming cluster using Sales, Profit, and discount.

Follow the below steps:

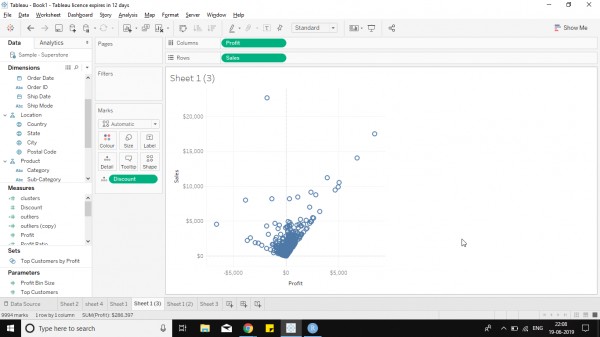
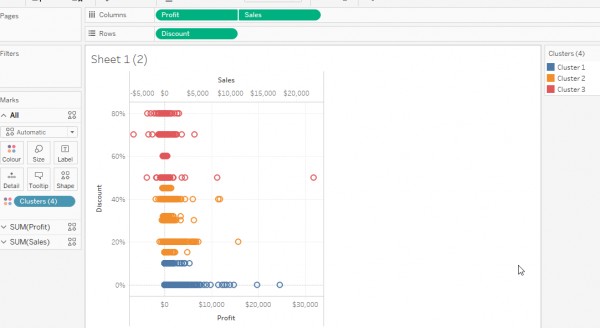
1. Create a chart like below

2. Create a calculated field as below

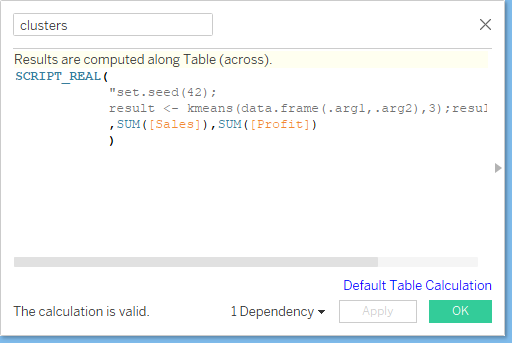
Explanation to the field code - 

  • Set,seed() is to Set the seed of R's random number generator, which is useful for creating simulations or random objects that can be reproduced. It can be omitted if wanted.
  • kmeans() is a function that performs the actual operation of forming clusters. It takes 2 parameters arguments and the number of clusters. arguments are taken from the expression in SCRIPT_REAL() function. The number of clusters can be static or dynamic by using a parameter to provide value.
  • data.frame() is used to convert the list of columns into a data frame and pass it as an argument to R functions.
  • .arg1,2,3 are arguments that are used in external scripts that fetch the value from tableau variables( fields, parameters, calculated fields) to perform any operations.

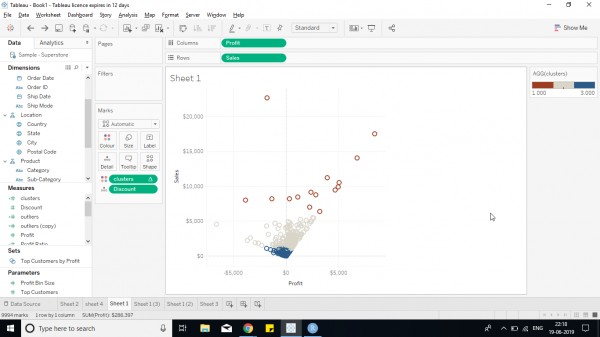
3. Drop the created field in the color shelf to observe the clusters.

Let me show you the difference between R and Tableau Clusters using sales-profit and discount

R cluster - using the created field in tableau

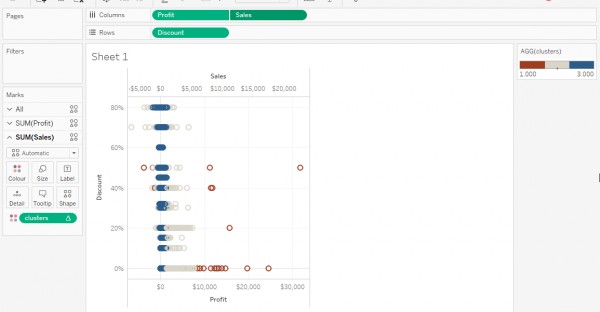
Tableau Clusters - using tableau inbuilt Clustering

Hope it helps you!

answered Jun 20, 2019 by Cherukuri
• 33,030 points

Related Questions In Tableau

0 votes
1 answer

Can someone tell me about some tips and tricks while using tableau?

1. Tableau tips and tricks: Calendar in ...READ MORE

answered Jul 4, 2018 in Tableau by ffdfd
• 5,550 points

edited Sep 21, 2021 by Soumya 461 views
+1 vote
1 answer

How to authenticate and embed Tableau Rest API using Python 2.7

Your .format() call is creating a bad ...READ MORE

answered Jul 19, 2018 in Tableau by Atul
• 10,240 points
2,596 views
0 votes
0 answers

Using Python and Tableau in conjunction with one another

Is it possible to mix Python visualisations ...READ MORE

Feb 28, 2022 in Tableau by Vaani
• 7,020 points
337 views
0 votes
0 answers

pre-requisites to learn Tableau and R

What are the pre-requisites to learn Tableau ...READ MORE

May 10, 2018 in Tableau by GandalfDwhite
• 1,320 points
380 views
0 votes
1 answer

Setup R in Tableau

Follow the below steps: 1. Install R studio from ...READ MORE

answered Jun 20, 2019 in Tableau by Cherukuri
• 33,030 points
637 views
0 votes
1 answer

Error: package or namespace load failed for ‘mvoutlier’

Hi Sindhu, The error tells that JAGS .exe ...READ MORE

answered Jun 20, 2019 in Tableau by Cherukuri
• 33,030 points
1,033 views
0 votes
1 answer
0 votes
1 answer

Find outliers in data using R in tableau

Hi Nithin, Follow the below steps: 1. Connect to ...READ MORE

answered Jun 20, 2019 in Tableau by Cherukuri
• 33,030 points
2,000 views
0 votes
1 answer

Forecast using R in Tableau

Let me explain using example forecast of profit ...READ MORE

answered Jun 21, 2019 in Tableau by Cherukuri
• 33,030 points
1,719 views
webinar REGISTER FOR FREE WEBINAR X
REGISTER NOW
webinar_success Thank you for registering Join Edureka Meetup community for 100+ Free Webinars each month JOIN MEETUP GROUP