Hi Nithin,
Follow the below steps:
1. Connect to Rserve from Tableau, To learn about connecting R and Tableau visit here.
https://www.edureka.co/community/49518/setup-r-in-tableau
Then install mvoutlier after setting Rserve() in R to use mvoutlier by writing below command.
install.packages("mvoutlier")
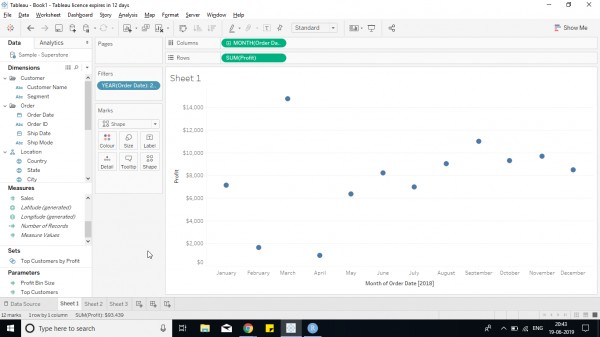
2. Create a chart as per requirement.
For example - I want to show the months that are outliers throughout a year.
3. Then Create a calculative field as below
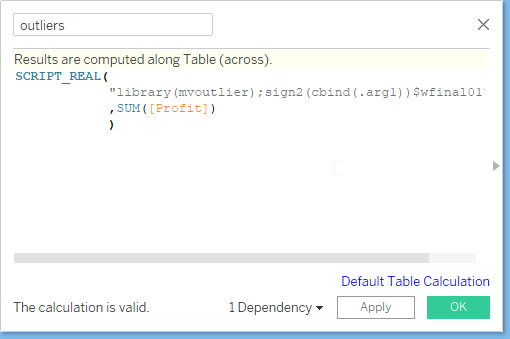
Explanation to the calculative field -
- SCRIPT_REAL(string, expression) Here string is the External commands and statements for operations such as clustering, forecast, etc. and expression is the tableau fields and aggregated fields needed for operation. To find the outliers in sum(sales), tableau needs to send data points SUM([Sales]) which are received by external variable using .arg1 for R, _arg1 for python.
- Multiple statements within an expression are separated using ; (semicolon).
- SCRIPT_REAL() > where REAL indicates the data type of data that is passed to an external source such as Python or R. Other options are INT, BOOL, STR.
- Library(mvoutlier) mvoutlier is a package that consists of all functions and modules required. It detects multivariate outliers based on Mahalanobis distance and adjusted Mahalanobis distance. The line means that the operation needs mvoutlier package.
- sign2() is a fast algorithm for identifying multivariate outliers in high-dimensional and/or large datasets, using spatial signs. The computation of the distances is based on principal components.
- cbind() is an R function that takes several column vectors as arguments, separated by commas, and combines them into a "data frame", which outside of R means a table or matrix.
- cbind(.arg1) is used to create a data frame $var01 from the list of Sum([Profit]) for all points that are present in the visual.
- .arg1 indicates an argument which is fetched in the second half of the function. multiple arguments can be given by writing .arg2, .arg3, etc and values given followed by SUM([Sales]),SUM([Profit]),etc.
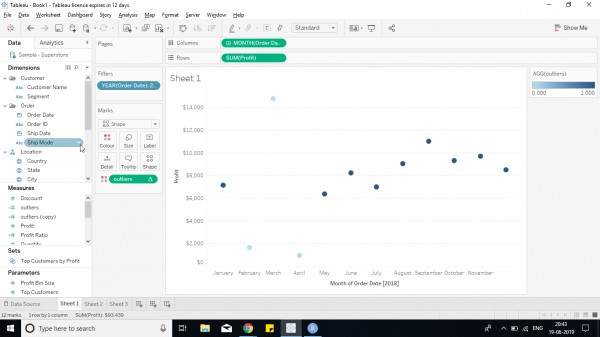
4. Drop the field in color shelf to see the outliers like below
Hope it helps!


