pie chart from a calculated field

0 votes
Hi, i'm a beginner in tableau. How to use calculative fields to form a pie chart?. i want to show the data obtained from calculative field in a pie charts. i have different groups in my data set which split the students into 4 categories depending on various parameters.Can u show with an example?
May 20, 2019 in Tableau by keerthana
2,173 views

1 answer to this question.

0 votes

Hi Keerthana,

As you have already created a calculated field with groups, its easy to form a pie chart, follow the below steps:

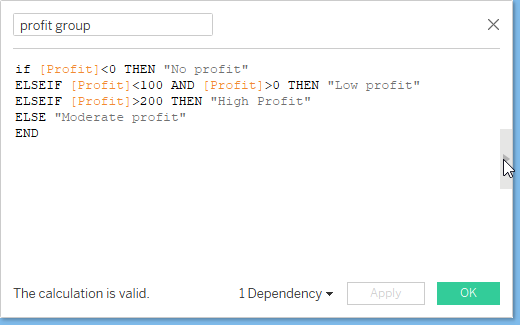
For ex: This is my calculative field that i'm using to show a pie chart.

IF [Profit]<0 THEN "No profit"
ELSEIF [Profit]<100 AND [Profit]>0 THEN "Low profit"
ELSEIF [Profit]>200 THEN "High Profit"
ELSE "Moderate profit"
END
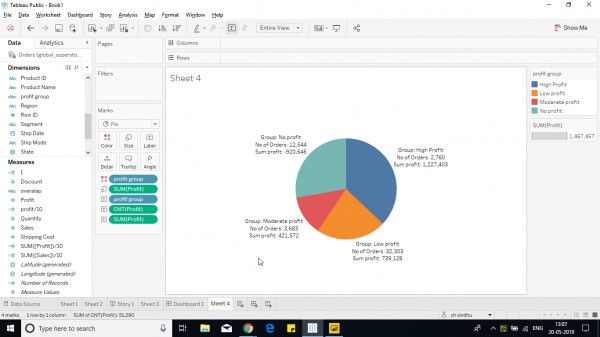
Select the marks shelf from automatic to pie.

Drop the field created in color shelf and the aggregation of measure in size shelf.
Hope it helps.

answered May 20, 2019 by Cherukuri
• 33,030 points

Related Questions In Tableau

0 votes
1 answer

How to create a single calculated field from multiple column filtering?

Try with this calculated field: ( ...READ MORE

answered Jul 6, 2018 in Tableau by ffdfd
• 5,550 points
994 views
0 votes
0 answers

How to we make a filter(from a calculated field) a context filter in Tableau

Booking Size is a computed field with ...READ MORE

Mar 10, 2022 in Tableau by Neha
• 9,060 points
617 views
0 votes
1 answer

Creating a calculated field with LOD expression

Go ahead and try the following three ...READ MORE

answered Apr 20, 2018 in Tableau by ffdfd
• 5,550 points
915 views
0 votes
1 answer

Tableau- Pie Chart with Multiple Measure Values

Hi Nithin, Pie chart is used to show ...READ MORE

answered Mar 11, 2019 in Tableau by Cherukuri
• 33,030 points
20,115 views
0 votes
1 answer

How to show percentages on the slices in pie chart in Tableau?

Hi sindhu, You can manually move the labels ...READ MORE

answered Mar 13, 2019 in Tableau by Cherukuri
• 33,030 points
10,981 views
0 votes
1 answer

Multiple labels in pie chart

Hi Rubia, You can add multiple labels in ...READ MORE

answered May 8, 2019 in Tableau by Cherukuri
• 33,030 points
2,251 views
0 votes
1 answer

How to color code cells of a column based on the text value in Tableau

You can use the following steps to ...READ MORE

answered Mar 27, 2018 in Tableau by Atul
• 10,240 points
9,441 views
0 votes
1 answer

Add reference line from calculated field.

Hi, Follow these steps: 1. Create the calculated field. 2. ...READ MORE

answered Mar 29, 2019 in Tableau by Cherukuri
• 33,030 points
7,512 views
0 votes
1 answer

A double pie chart - Pie chart within another pie chart.

Hi sindhu, Follow below steps: 1. Plot a pie ...READ MORE

answered Apr 3, 2019 in Tableau by Cherukuri
• 33,030 points
499 views
webinar REGISTER FOR FREE WEBINAR X
REGISTER NOW
webinar_success Thank you for registering Join Edureka Meetup community for 100+ Free Webinars each month JOIN MEETUP GROUP