Hi Nithin,
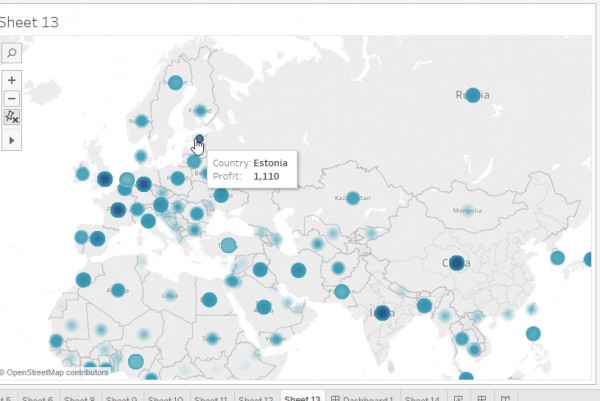
Follow the below steps to create the above map -
1. Double click on Country. (for ex, I have taken sales)
2. Now double click on population field.
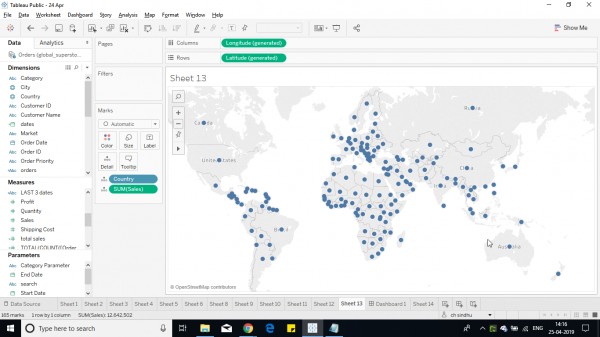
3. Now select Density instead of Automatic in the drop down below marks shelf.
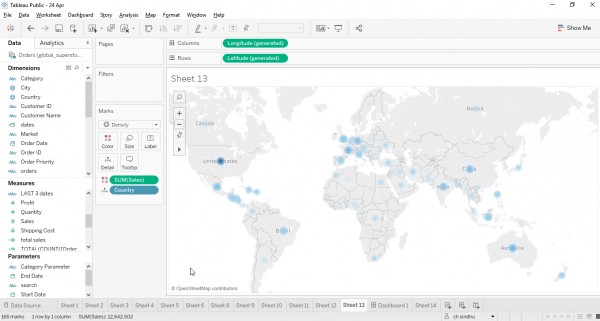
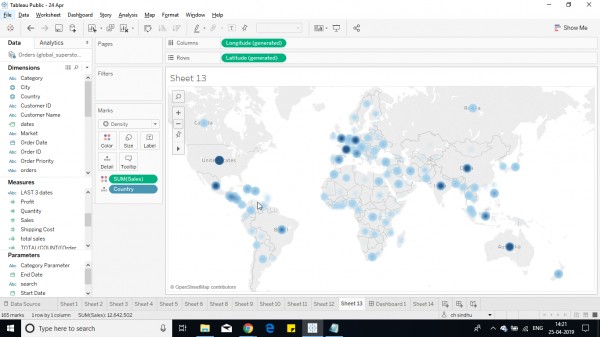
4. Drop the popultion in the color shelf and edit the size shelf to increase the size of marks.
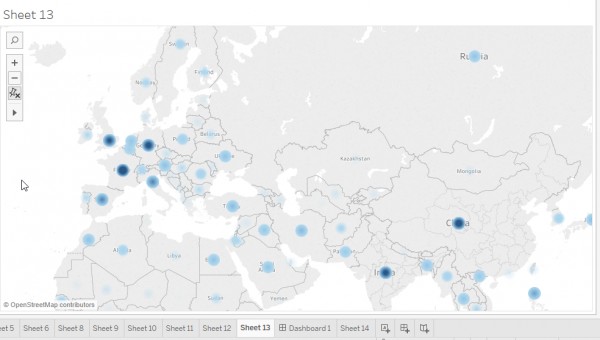
5. Click on the Color shelf and increase the internsity of the marks.
Hope it helps you.
 REGISTER FOR FREE WEBINAR
X
 Thank you for registering
Join Edureka Meetup community for 100+ Free Webinars each month
JOIN MEETUP GROUP