To Develop PowerBI Visuals

0 votes

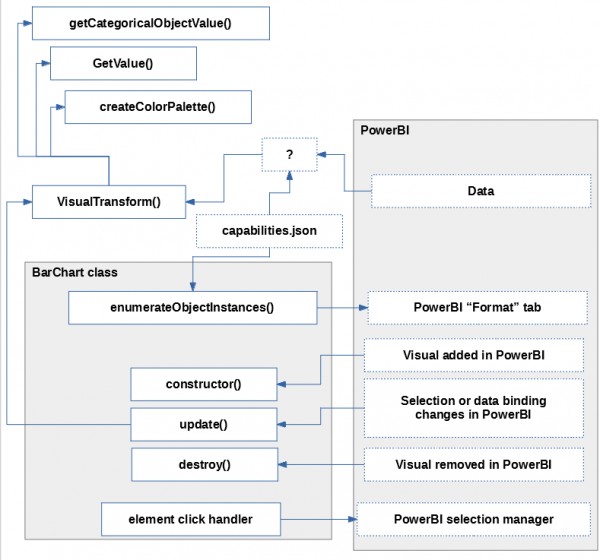
I hope I'm not asking too much, but could someone, using this bar chart as an example, post a sequence of which methods in the visual source are called (and how the data is converted and passed) when:

  • The visual is added to the dashboard in PowerBI,

  • A category and a measure are assigned to the visual,

  • Data filter in PowerBI changes,

  • An element on our custom visual is selected.

  • Your option which you think may be relevant


I used this specific visual as an example because it was mentioned as meeting minimum requirements for contributing a new custom visual, which sounds like a good starting point, source:

New Visual Development

Please follow our minimum requirements for implementing a new visual. See the wiki here.

(the link references the bar chart tutorial)

However, if you have a better example visual - please use that instead.


This is all I got:
Nov 15, 2018 in Power BI by Shubham
• 13,490 points
514 views

1 answer to this question.

0 votes

A few comments on your graphic. You are obviously using the view model (good):

  • After any data change, filter change, or object change (format in your pic), visualTransform() is called. The data comes in odd formats so will need repackaging (for anything other than simple). That gets done here and a data object that the developer defines gets returned. I build this data object as an array because d3 loves arrays.
  • update() is then called (I think your arrow in the pic here is the wrong way around). This is slightly tricky because d3 interaction now comes into play. If you have used d3().enter (and you probably have) then that executes only once so on a subsequent PBI update() only d3() non-enter instructions are followed. If you put everything in d3().enter then any subsequent data update won't appear to work.
  • Alternatively you can d3().remove() and rebuild the svg on each PBI update(). Whether this is practical will depend on your data and the visual.

Thank you for having a crack at documenting the flow. MS documentation is very lame at the moment.

answered Nov 15, 2018 by Upasana
• 8,620 points

Related Questions In Power BI

0 votes
1 answer

How to calculate PowerBI / DAX - Row wise division by measure?

As for your question, I think you're ...READ MORE

answered Oct 8, 2020 in Power BI by Gitika
• 65,770 points
3,933 views
0 votes
1 answer

How to import data model from Excel in PowerBI?

You may try to divide your data ...READ MORE

answered Oct 22, 2020 in Power BI by anonymous
• 65,770 points
1,690 views
0 votes
1 answer

How to connect to data with PowerBI desktop?

With Power BI Desktop, you can connect ...READ MORE

answered Oct 27, 2020 in Power BI by Rajiv
• 8,870 points
704 views
0 votes
1 answer

How to convert date format in PowerBI?

Change the column data type in excel ...READ MORE

answered Oct 29, 2020 in Power BI by anonymous
• 65,770 points
1,097 views
0 votes
1 answer

Displaying Table Schema using Power BI with Azure IoT Hub

Answering your first question, Event Hubs are ...READ MORE

answered Aug 1, 2018 in IoT (Internet of Things) by nirvana
• 3,130 points
1,349 views
+1 vote
1 answer

Unable to install connector for Power Bi and PostgreSQL

I think the problem is not at ...READ MORE

answered Aug 22, 2018 in Power BI by nirvana
• 3,130 points
2,746 views
+2 votes
2 answers

Migrate power bi collection to power bi embedded

I agree with Kalgi, this method is ...READ MORE

answered Oct 11, 2018 in Power BI by Hannah
• 18,520 points
1,517 views
+1 vote
1 answer

Connect power bi desktop to dataset and create custom reports

Yes using Power BI REST API to ...READ MORE

answered Sep 18, 2018 in Power BI by Kalgi
• 52,350 points
1,666 views
0 votes
1 answer

Calculate Time Intersection to Correlate Sequences of Independent Events

I think this solution requires a CROSS JOIN implementation. ...READ MORE

answered Oct 26, 2018 in Power BI by Upasana
• 8,620 points
804 views
0 votes
1 answer

Error:connecting to Azure SSAS server in Power-BI through Import mode

If I understand correctly, you're connecting to ...READ MORE

answered Nov 9, 2018 in Power BI by Upasana
• 8,620 points
2,677 views
webinar REGISTER FOR FREE WEBINAR X
REGISTER NOW
webinar_success Thank you for registering Join Edureka Meetup community for 100+ Free Webinars each month JOIN MEETUP GROUP