Hi Sindhu,
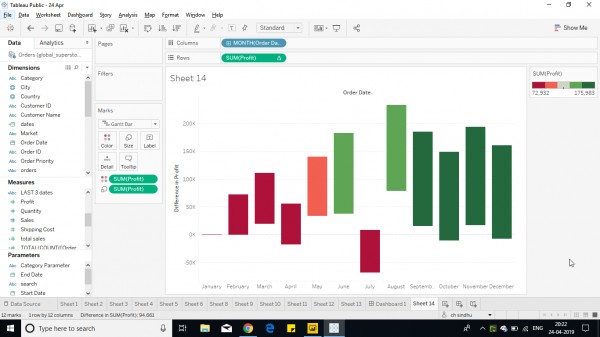
Follow below steps:
1. Add sales and date field to the sheet.
2. Now Right click on sales field and add a quick calculation to difference.
3. Now Change Bar chart to Gantt chart by selecting under marks pane.
4. Add sales to the color shelf.
5. Edit the colors for the group and make it 2 steppes to observe the difference for decrease and increase for better visual.

Hope it helps you.
 REGISTER FOR FREE WEBINAR
X
 Thank you for registering
Join Edureka Meetup community for 100+ Free Webinars each month
JOIN MEETUP GROUP