Hi,
Follow theses steps:
1. Select profit and order date and make a bar chart.
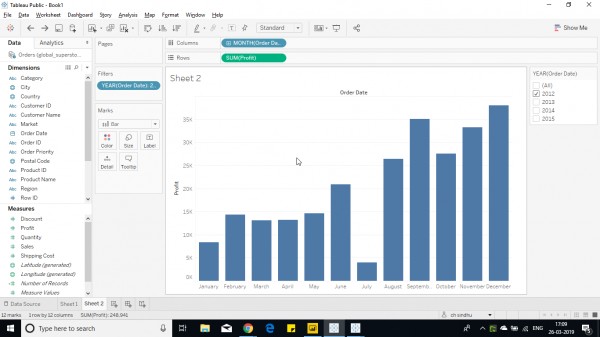
2. Convert profit to running total from quick table calculation, as waterfall model is formed on running totals.
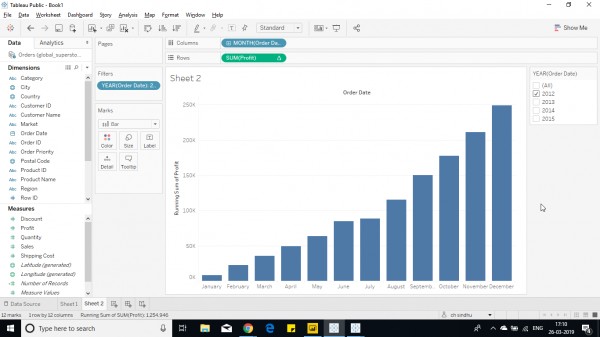
3. Now select Gantt Bar from the Marks pane.
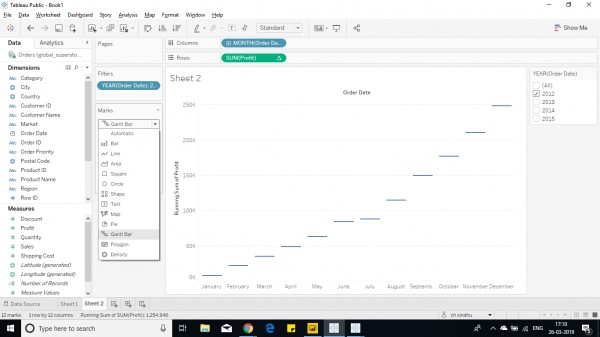
4. Add the grand total from analytics pane.
5. Add a calculated field, to get the bar size of profit for month as -SUM(Profit) and drop it in size shelf to get the size of profit/loss
6. Now add grand total to the chart.
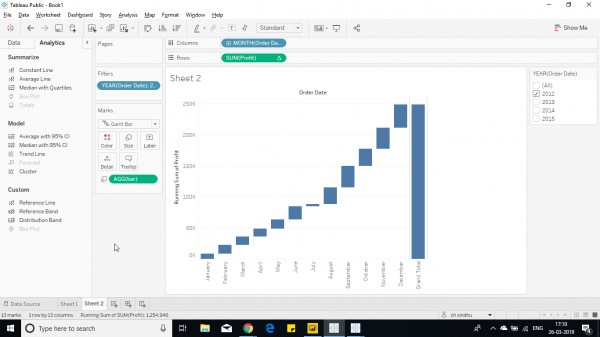
7. Now add the category to color shelf.
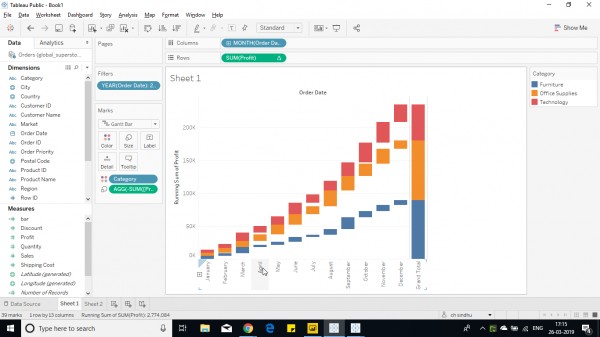
Hope this helps you.
 REGISTER FOR FREE WEBINAR
X
 Thank you for registering
Join Edureka Meetup community for 100+ Free Webinars each month
JOIN MEETUP GROUP