Hi Banu,
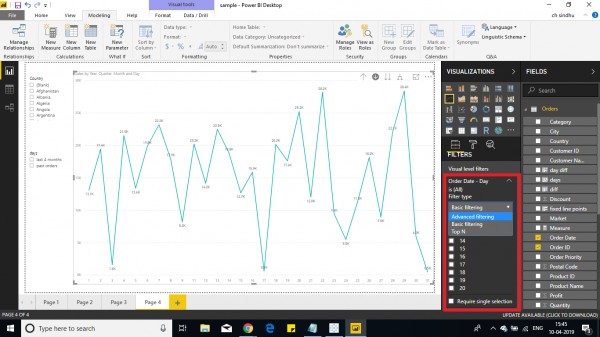
While creating a chart, put the field that you want to show few points in any of the filters available - visual/ page/ report level filters.
1.For suppose you can show data points on the graph using a basic selection.

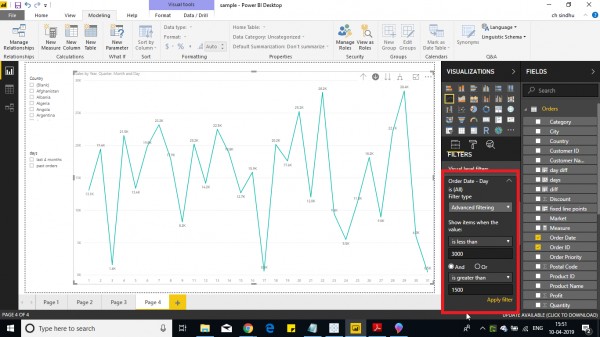
2. Advanced filtering by Top N or simple > or < comparison.

2. Other way of selecting from whole set of data points is through quick measures.
3. Add a slicer to select points using various combination.
Hope this will help you.
 REGISTER FOR FREE WEBINAR
X
 Thank you for registering
Join Edureka Meetup community for 100+ Free Webinars each month
JOIN MEETUP GROUP