Hi,
Funnel chart is normally used in sales or to track control over leads for marketing/sales companies.
Follow these steps to create a simple funnel chart:
For suppose if you want to show the leads for a company product.
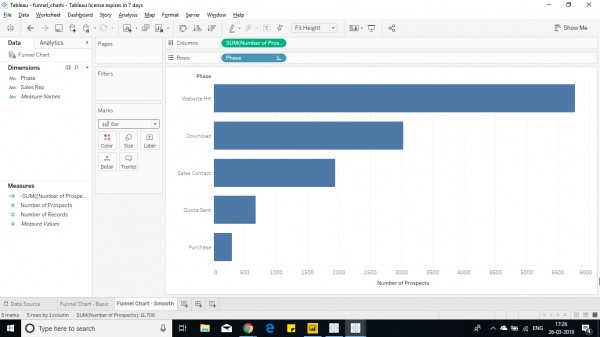
1. Select the phases and the number of leads and make a bar graph.

2. Sort the phases as per requirement (for ex: marketing->sales->customer)
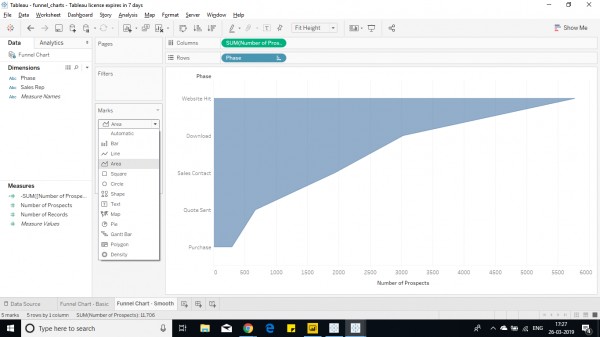
3. Convert the bar to area chart from marks pane.

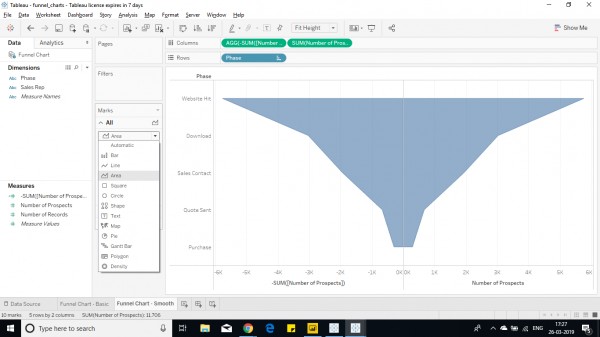
4. Now Create calculated field as - number of leads/visitors.
5. Drop the field into shelf to make it symmetric.

6. Now add the labels and format the graph as per requirement.
Hope this help you.
 REGISTER FOR FREE WEBINAR
X
 Thank you for registering
Join Edureka Meetup community for 100+ Free Webinars each month
JOIN MEETUP GROUP