Hi sindhu,
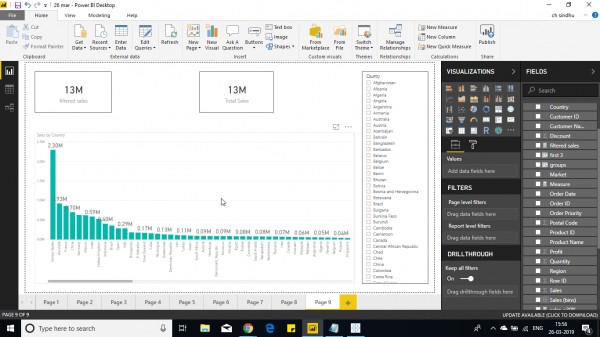
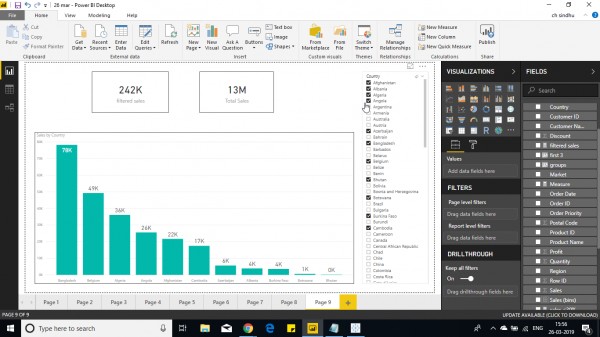
Follow below steps to show filtered vs total sales.
1. Create a slicer and add country.
2. Create a bar chart with country and sales.
3. Create measure Total Sales = CALCULATE(SUM(Orders[Sales]),ALL(Orders[Country]))
4. Create measure Filtered Sales = Ceiling(SUM(Orders[Sales]))
4. Now create 2 cards one for total sales and another for filtered sales.

5. Now add the country in the filter. You can observe the filtered vs total sales.

Hope this helps you.
If you are interested in learning Power BI, then check out Power BI Online Training now!
 REGISTER FOR FREE WEBINAR
X
 Thank you for registering
Join Edureka Meetup community for 100+ Free Webinars each month
JOIN MEETUP GROUP