Hi @Vikas, there are 5 simple steps to analyze the heatmap correlation:
1. Import data
data = pd.read_csv('file_clean.csv')
2. Create correlation matrix. .corr() is used to create the correlation matrix. You'll have to make sure that all the elements in the matrix are of numeric type. If they are not of the numeric type you'll have to add or concat them explicitly.
corr = data.corr()
3. Create heatmap in seaborn:
ax = sns.heatmap(
    corr,
    vmin=-1, vmax=1, center=0,
    cmap=sns.diverging_palette(20, 220, n=200),
    square=True
)
ax.set_xticklabels(
    ax.get_xticklabels(),
    rotation=45,
    horizontalalignment='right'
);
You'll see something like this where the blue indicates positive and red indicates negative.

Now to start analyzing the heatmap correlation, ask yourself this question:
What's the weakest and strongest correlation pair?
I am assuming its difficult to analyze right?
Now according to your dataset, you need to create a scatter plot which makes it easier to analyze.
def heatmap(x, y, size):
    fig, ax = plt.subplots()

    # Mapping from column names to integer coordinates
    x_labels = [v for v in sorted(x.unique())]
    y_labels = [v for v in sorted(y.unique())]
    x_to_num = {p[1]:p[0] for p in enumerate(x_labels)}
    y_to_num = {p[1]:p[0] for p in enumerate(y_labels)}

    size_scale = 500
    ax.scatter(
        x=x.map(x_to_num), # Use mapping for x
        y=y.map(y_to_num), # Use mapping for y
        s=size * size_scale, # Vector of square sizes, proportional to size parameter
        marker='s' # Use square as scatterplot marker
    )

    # Show column labels on the axes
    ax.set_xticks([x_to_num[v] for v in x_labels])
    ax.set_xticklabels(x_labels, rotation=45, horizontalalignment='right')
    ax.set_yticks([y_to_num[v] for v in y_labels])
    ax.set_yticklabels(y_labels)

data = pd.read_csv('https://raw.githubusercontent.com/drazenz/heatmap/master/autos.clean.csv')
columns = ['bore', 'stroke', 'compression-ratio', 'horsepower', 'city-mpg', 'price']
corr = data[columns].corr()
corr = pd.melt(corr.reset_index(), id_vars='index') # Unpivot the dataframe, so we can get pair of arrays for x and y
corr.columns = ['x', 'y', 'value']
heatmap(
    x=corr['x'],
    y=corr['y'],
    size=corr['value'].abs()
)
You'll get something like this:
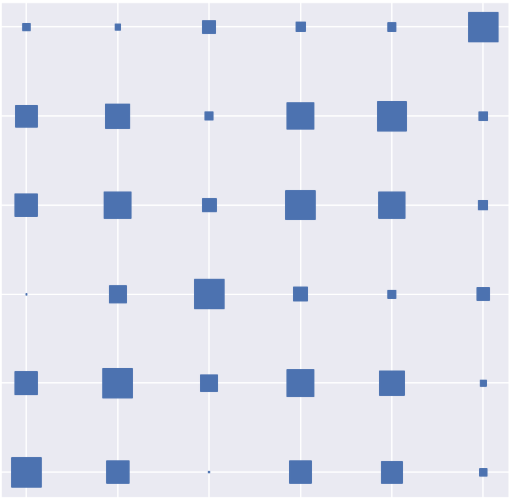
Make a few modifications(get the plots in between the grid)
ax.grid(False, 'major')
ax.grid(True, 'minor')
ax.set_xticks([t + 0.5 for t in ax.get_xticks()], minor=True)
ax.set_yticks([t + 0.5 for t in ax.get_yticks()], minor=True)
And you are good to go!


