Create a sample visual in power BI using Python script

0 votes
Create a sample visual in power BI using Python script. Basic steps to run a Python script.
Jun 20, 2019 in Power BI by Rahul
7,167 views

1 answer to this question.

0 votes

Follow the below steps:

1. Run Power BI and load the data source.

2. If Python Script does not exist, then to setup python script in Power BI visit below link,

https://www.edureka.co/community/49714/setup-python-with-power-bi

3. Once Python is setup. Click on Python Script on the desktop window.

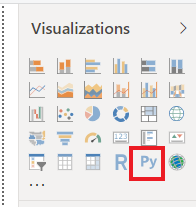
4. Python script visual is seen on the screen.

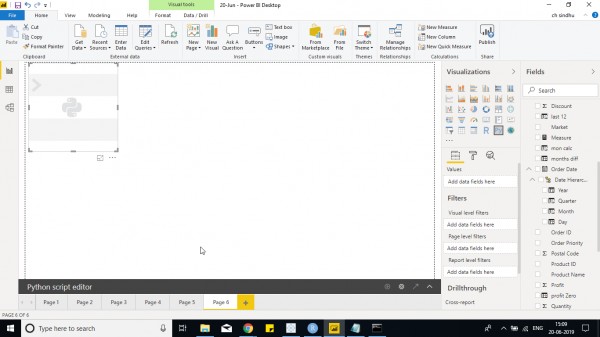
5. Go to Python script and select the fields that you want to use in visual.

6. Now install matplotlib in python using pip.

7. Then write code as below - to create a bar chart.

import matplotlib.pyplot as plt

plt.bar(dataset.Market,dataset.Sales)

plt.xlabel("Sales")

plt.ylabel("Profit")

plt.show()

To create a Scatter chart using Python - use below code with different fields as required.

import matplotlib.pyplot as plt

plt.plot(dataset.Sales,dataset.Profit,'go')

plt.xlabel("Sales")

plt.ylabel("Profit")

plt.show()

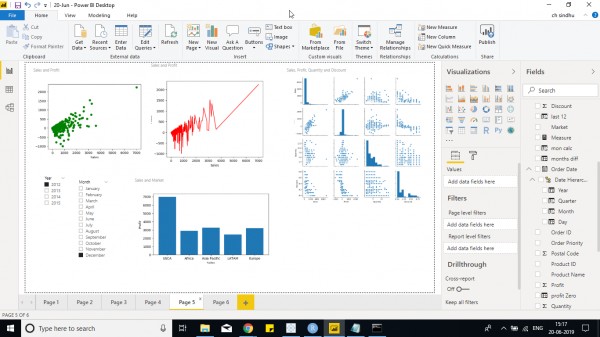
Another example of pair plot that is present on the top right side of the screen with multiple graphs is used to show the correlation of different fields.

import matplotlib.pyplot as plt

import seaborn as ssn

ssn.pairplot(dataset)

plt.show()

In the above 2 Python scripts, within ' '  indicates the type of plot and color such as g,r indicates green and red color for the graph and o,- indicates scatter plot or dashed line chart and combining both you would get a dual axis chart.

So you can play around with plot function and different plots available using format. 

Different plot libraries are available in python to use other than mathplotlib. One such package is seaborn

I have created few charts in Power BI using Python, You can check out them below - 

answered Jun 20, 2019 by Cherukuri
• 33,030 points

Related Questions In Power BI

0 votes
0 answers

Create a sample report in power BI using R script

how to create a sample chart using ...READ MORE

Jun 20, 2019 in Power BI by Anitha
489 views
0 votes
1 answer

How do you create a link visual in Power BI?

You can easily create a link between ...READ MORE

answered Mar 9, 2019 in Power BI by Avantika
• 1,520 points

edited Mar 9, 2019 by Avantika 4,366 views
0 votes
1 answer

Can I create a Power BI report in Office 365 without my locally installed Office Excel?

Yess!! You can achieve this by using ...READ MORE

answered Sep 26, 2018 in Power BI by Kalgi
• 52,360 points
712 views
0 votes
1 answer

To create link visual in Power BI

You can disable sandboxing by adding this ...READ MORE

answered Nov 22, 2018 in Power BI by Upasana
• 8,620 points
635 views
0 votes
2 answers
+1 vote
2 answers

how can i count the items in a list?

Syntax :            list. count(value) Code: colors = ['red', 'green', ...READ MORE

answered Jul 7, 2019 in Python by Neha
• 330 points

edited Jul 8, 2019 by Kalgi 4,023 views
0 votes
1 answer
0 votes
1 answer

How to rename a column using DAX in Power BI?

Hi Ramya, I found these two function that ...READ MORE

answered Aug 22, 2019 in Power BI by anonymous
• 33,030 points

edited Dec 31, 2021 by Soumya 32,911 views
0 votes
3 answers

How to create final table based on Joins of two tables in power BI?

To do so, follow these steps: From the ...READ MORE

answered Dec 16, 2020 in Power BI by Gitika
• 65,910 points
53,521 views
webinar REGISTER FOR FREE WEBINAR X
REGISTER NOW
webinar_success Thank you for registering Join Edureka Meetup community for 100+ Free Webinars each month JOIN MEETUP GROUP