How to show a chart with only a part of the dimension measure value

0 votes

How to show a chart with only a part of the dimension/measure value. I want to plot a graph of sales for the first 100 orders in each region. Later i put all sheets in one dashboard and compare it. The order is a alpha numerical value with country code-shop-code-order-id. How to plot?

Apr 2, 2019 in Tableau by Nithin
474 views

1 answer to this question.

0 votes

Hi Nithin,

Follow below steps:

1. Create a calculative field like below to split the order-id to get only order count.
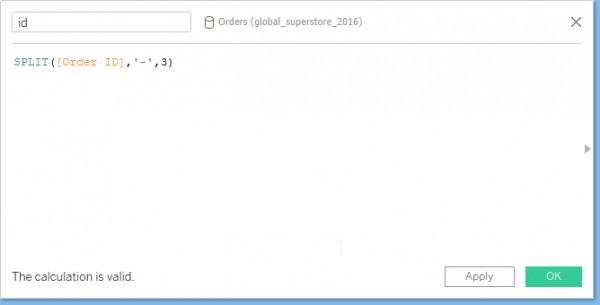
2. Add region into filter shelf.

3. Now add this into filter shelf and edit the filter as below to get top 100. Change to maximum and sales to get top 100 orders with maximum sales.
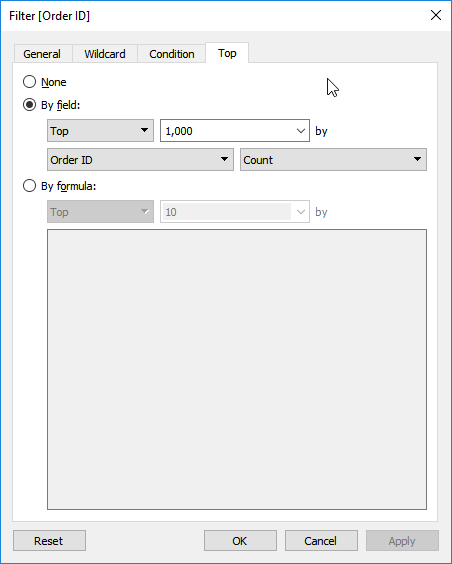
3. Now add the field id and other measures into graph and sort the id field to get top 100 id in order.

Hope this helps you.

answered Apr 2, 2019 by Cherukuri
• 33,030 points

Related Questions In Tableau

0 votes
1 answer

How to color code cells of a column based on the text value in Tableau

You can use the following steps to ...READ MORE

answered Mar 27, 2018 in Tableau by Atul
• 10,240 points
9,371 views
0 votes
1 answer

How to get multiple Sets of Measure Names with different Filters on a single sheet in Tableau?

The easiest solution to your query is: 1) ...READ MORE

answered Aug 23, 2018 in Tableau by Naruto
• 710 points
14,710 views
0 votes
1 answer

how to get the count of non zero values in a row

In first part you should solve the ...READ MORE

answered Apr 4, 2018 in Tableau by Atul
• 10,240 points
2,827 views
0 votes
2 answers

How can I add text in the centre of a Donut Chart ?

Hi, You can read this for creating a donut ...READ MORE

answered Apr 4, 2019 in Tableau by Cherukuri
• 33,030 points
11,431 views
0 votes
1 answer

Reset filters in Tableau

I understood your question (I hope so!). ...READ MORE

answered Mar 30, 2018 in Tableau by QueenBee
• 1,820 points
3,716 views
0 votes
1 answer

How to create a global filter

Assuming you have created a dashboard already, ...READ MORE

answered Apr 13, 2018 in Tableau by QueenBee
• 1,820 points
1,197 views
0 votes
1 answer

How can I create a second sheet which is filtered to 8 days ago,

Following are the steps you can follow: Create ...READ MORE

answered Jul 11, 2018 in Tableau by ffdfd
• 5,550 points
628 views
0 votes
1 answer

How to filter/parameter for different date ranges

Steps: Create a parameter control that the users ...READ MORE

answered Jun 21, 2018 in Tableau by Atul
• 10,240 points
4,752 views
0 votes
1 answer

In Tableau, how to pass measure/dimension to action filters that are not in the chart?

Hi Sindhu,  You can choose the fields that are ...READ MORE

answered Mar 11, 2019 in Tableau by Cherukuri
• 33,030 points
4,975 views
+1 vote
1 answer

How to show flag at the end of the bar chart?

Hi priyanka, Follow the below steps: 1. Create a ...READ MORE

answered Jun 6, 2019 in Tableau by Cherukuri
• 33,030 points
7,755 views
webinar REGISTER FOR FREE WEBINAR X
REGISTER NOW
webinar_success Thank you for registering Join Edureka Meetup community for 100+ Free Webinars each month JOIN MEETUP GROUP