How to add custom labels to bar chart and grand total charts

0 votes
Hi, how to add the field name, parameter value along with calculated value as the label of the chart?
Mar 4, 2019 in Tableau by anonymous
3,068 views

1 answer to this question.

0 votes

Hi, Once you created the bar chart (with or without grand totals). you can click on analysis tab on the left side of the screen.
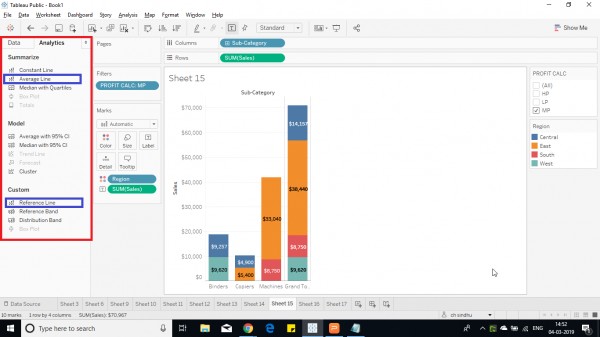
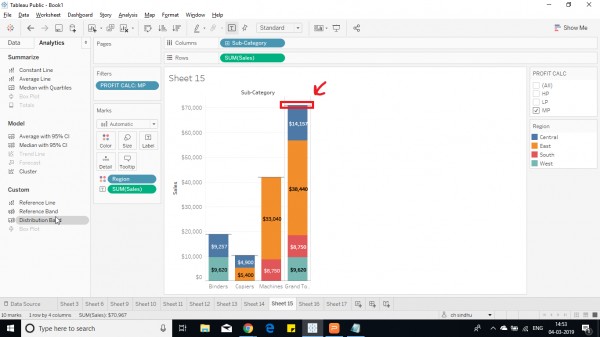
Drag either average line or reference line and drop on each cell pane. Then click on the line and click on edit option.
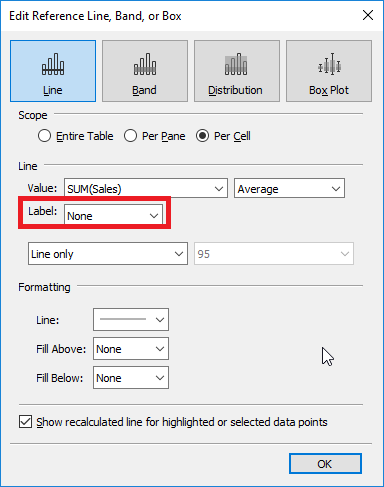
Then this window is shown. select the computation required then click on the drop down box near label, then click on custom.
Then another box opens next to it. then click on the arrow button, it shows you options to add in the label. Fields used in the chart and extra text can also be displayed on the label such as text or symbols,etc.like <Field Name> = <Value> .
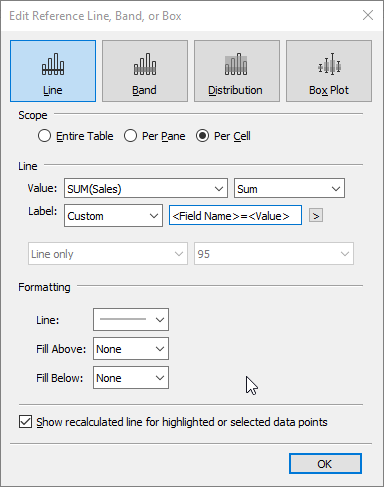
This way you can have custom fonts.

Hope this helps you.

answered Mar 4, 2019 by Cherukuri
• 33,030 points

Related Questions In Tableau

0 votes
1 answer

How to add grand totals of the bar in Stacked Bar in Tableau

Hi Grim, As you have used reference line ...READ MORE

answered Sep 24, 2018 in Tableau by Machdata
• 340 points
5,252 views
0 votes
1 answer

Want to hide the Bar for Grand Total in the bar chart in Tableau

Tableau treats the whole visualization uniformly.  If you ...READ MORE

answered Aug 10, 2018 in Tableau by AwesomeSauce
• 860 points
3,783 views
0 votes
2 answers

How can I display filtered value and grand total in the same sheet?

You can create a fixed calculated field ...READ MORE

answered Sep 15, 2018 in Tableau by Machdata
• 340 points
1,024 views
0 votes
1 answer

How to add parameter and calculated field filter in tableau?

Hi Sindhu,  You cannot add parameter as a ...READ MORE

answered Mar 8, 2019 in Tableau by Cherukuri
• 33,030 points
5,003 views
0 votes
1 answer

How to add a story with same sheet with different parameters and filters added in tableau?

Hi Riya, Follow these steps to add sheets/dashboard ...READ MORE

answered Mar 22, 2019 in Tableau by Cherukuri
• 33,030 points
3,484 views
0 votes
1 answer

How to show % difference between bar chart to show increase or decrease?

Hi Anshuli, Make the bar chart first for ...READ MORE

answered Apr 5, 2019 in Tableau by Cherukuri
• 33,030 points
10,881 views
0 votes
1 answer

How to add custom shape in tableau?

Hi Sindhu, Follow below steps : 1. Select required ...READ MORE

answered Apr 22, 2019 in Tableau by Cherukuri
• 33,030 points
3,379 views
0 votes
1 answer

How to show % of the total to each bar in bar graph?

Hi Manu, It is a simple procedure, Follow ...READ MORE

answered Apr 22, 2019 in Tableau by Cherukuri
• 33,030 points
1,035 views
0 votes
1 answer

How to Add a Grand Average bar to an existing bar chart.

Hi Anitha, Its easy and simple, follow below steps: 1. ...READ MORE

answered Apr 4, 2019 in Tableau by Cherukuri
• 33,030 points
4,283 views
0 votes
1 answer

how to add grand total for discrete fields (columns)?

Hey, You cannot add Grand Total for discrete ...READ MORE

answered Oct 21, 2019 in Tableau by anonymous
• 33,030 points
5,506 views
webinar REGISTER FOR FREE WEBINAR X
REGISTER NOW
webinar_success Thank you for registering Join Edureka Meetup community for 100+ Free Webinars each month JOIN MEETUP GROUP