To Calculate the Standard Deviation in Power BI

0 votes

So, I am trying to calculate the standard deviation of a set of values in PowerBI. There are two columns-namely, days & count- in a table representing frequency distribution of a transportation lane. Days are numbered 1 through 100, count is the number of shipments that took those number of days.

The formula to calculate the standard deviation of a frequency distribution is pretty straightforward: sqrt(sum(fx * (x - avgx)^2))/sum(fx)) But I can't really figure out the DAX. I'd appreciate any help. Thanks.

Nov 26, 2018 in Power BI by Shubham
• 13,490 points
15,662 views

1 answer to this question.

0 votes

Suppose you've to obtain the Standard Deviation of the following data;

2,4,4,4,5,5,7,9

The mean(average) of the sample set = 5

First, you need to calculate the deviation of each element from the mean. (Basically, the squared difference of each element from the mean)

The mean of all deviations is the population variance. In this case, it is 4.

And the standard deviation is the square root of the population variance =2.

If you convert it into its Power BI equivalent,
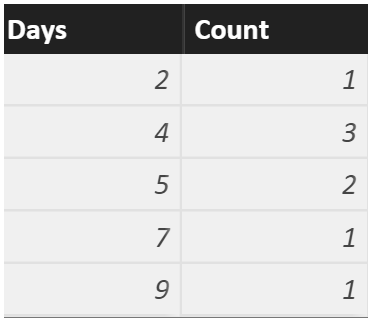
And the measure is created as follows, the tricky part is to make use of the SUMX function. It's always convenient to break down the intermediate steps with VAR to make it more clear.

As a result, you get,
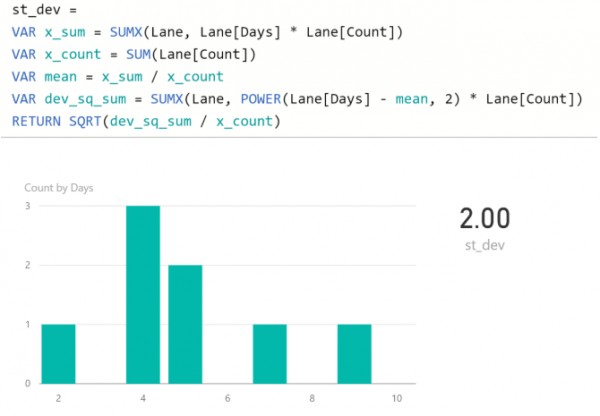
P.S. Power BI does have a built-in function for calculating standard deviation(e.g. STDEVX.P). However, it's not always useful. Do feel free to check it out though.

answered Nov 26, 2018 by Upasana
• 8,620 points

Related Questions In Power BI

0 votes
1 answer

What are the components I need to excel to become a pro in power BI

Having knowledge about these topics is a must.  Power ...READ MORE

answered Oct 8, 2018 in Power BI by Kalgi
• 52,350 points
872 views
0 votes
1 answer

How to open hyperlink in the same tab in power BI

Hey, the discussion on this topic is ...READ MORE

answered Jul 10, 2019 in Power BI by anonymous
• 33,030 points
11,002 views
0 votes
1 answer

How to customize the report for different users in power BI?

There are different ways to achieve this. 1. ...READ MORE

answered Oct 30, 2019 in Power BI by Cherukuri
• 33,030 points
4,208 views
0 votes
3 answers

How to add an extra column to the existing table in power bi query editor?

Click on edit queries after loading source ...READ MORE

answered Dec 16, 2020 in Power BI by Roshni
• 10,480 points
79,063 views
+3 votes
2 answers

Combine tables in Power BI

You can also achieve this using a ...READ MORE

answered Oct 5, 2018 in Power BI by lina
• 8,220 points

edited Oct 11, 2018 by Kalgi 2,485 views
0 votes
1 answer

Power Bi Dax Table

You need to wrap the numbers in ...READ MORE

answered Oct 5, 2018 in Power BI by Kalgi
• 52,350 points
1,176 views
0 votes
2 answers

Power BI Dax Multiple IF AND Statements

HI I have Column Patient 12 13 14 15 18 IN Patient=12, 13 Out ...READ MORE

answered May 23, 2019 in Power BI by VNK
18,967 views
0 votes
1 answer

Distinct count filtered by condition using Power BI Dax

Try this, it should work: DistinctCountActiveMonths = CALCULATE( ...READ MORE

answered Oct 5, 2018 in Power BI by Kalgi
• 52,350 points
37,680 views
0 votes
1 answer

How can i see my plugin name in the Power BI Visual plugin List ?

there is a couple of errors in your ...READ MORE

answered Nov 8, 2018 in Power BI by Upasana
• 8,620 points
1,440 views
0 votes
1 answer

Error:connecting to Azure SSAS server in Power-BI through Import mode

If I understand correctly, you're connecting to ...READ MORE

answered Nov 9, 2018 in Power BI by Upasana
• 8,620 points
2,676 views
webinar REGISTER FOR FREE WEBINAR X
REGISTER NOW
webinar_success Thank you for registering Join Edureka Meetup community for 100+ Free Webinars each month JOIN MEETUP GROUP