Hi @radha,
You can have 2 types of a bar chart in ggplot ( Continuos or discrete )
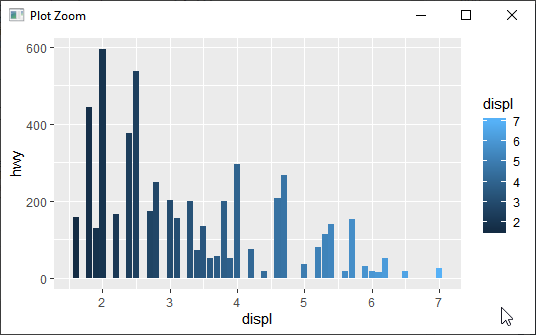
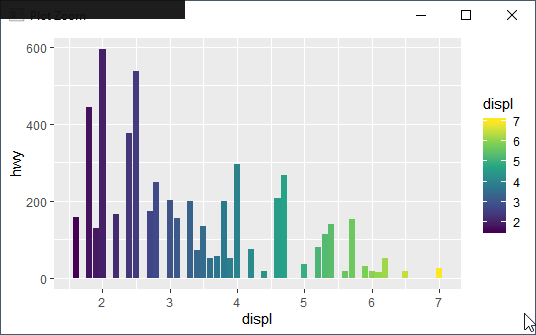
For Continuous, You have 2 types of color scales, default and Viridis.
ggplot(mpg, aes(displ, hwy, fill = displ)) + geom_bar(stat = "identity")
ggplot(mpg, aes(displ, hwy, fill = displ)) + geom_bar(stat = "identity") + scale_fill_continuous(type = "viridis")
You can see below colors,


For discrete bars, you can provide colors or default colors by R.
You can change the palette using scale_colour_brewer(palette = "Set1,2, ... ") to chnage the colors.
Alternative using scale_fill_manual(values = c("red","blue","green","yellow"))
 REGISTER FOR FREE WEBINAR
X
 Thank you for registering
Join Edureka Meetup community for 100+ Free Webinars each month
JOIN MEETUP GROUP