Change the order of multiple legends in ggplot

0 votes

HI, how to change the order of multiple legends in ggplot?

Im using below code to build my ggplot.

ggplot(mpg, aes(displ, hwy, col = class)) + geom_point(size = 2,aes(shape = factor(cyl))) + theme(legend.box.background = element_rect(color = "red",fill = "grey"),legend.box.margin = margin(0.4,0.4,0.4,0.4,"cm")) + theme(legend.position = "bottom",legend.box = "vertical")
Jul 23, 2019 in Data Analytics by radha
24,863 views

1 answer to this question.

0 votes

Hi Radha,

You can change the order of legends in any order using the order attribute within the function of the guide.

Suppose my legends are as below - 

ggplot(mpg, aes(displ, hwy, col = cyl)) + geom_point(size = 2,aes(shape = factor(cyl))) + theme(legend.box.margin = margin(0.3,0.3,0.3,0.3,"cm"),legend.background = element_rect(color = "yellow")) + guides(shape = guide_legend(title = "cyl")) + scale_shape_discrete(labels = c("a","b","c","d")) + theme(legend.position = "bottom")
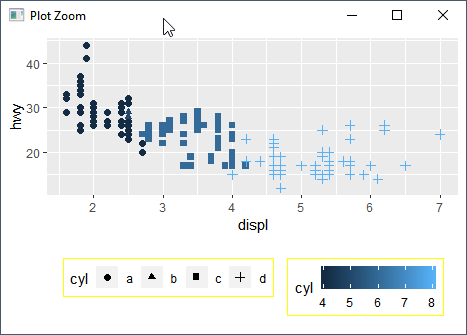
I change the order using code below - 

ggplot(mpg, aes(displ, hwy, col = cyl)) + geom_point(size = 2,aes(shape = factor(cyl))) + theme(legend.box.margin = margin(0.3,0.3,0.3,0.3,"cm"),legend.background = element_rect(color = "yellow")) + guides(shape = guide_legend(title = "cyl")) + scale_shape_discrete(labels = c("a","b","c","d")) + theme(legend.position = "bottom") + guides(shape = guide_legend(order = 2),col = guide_legend(order = 1))
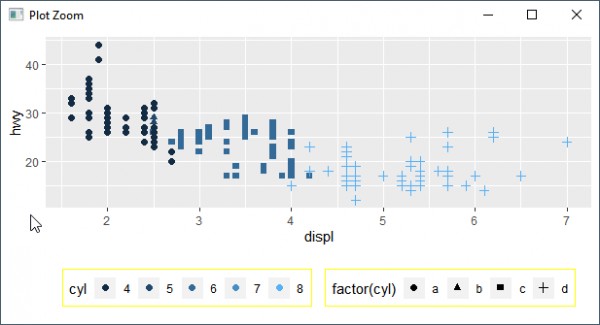
answered Jul 24, 2019 by Cherukuri
• 33,030 points

Related Questions In Data Analytics

0 votes
0 answers

Arrange the order of axis elements in ggplot

How to arrange the order of axis ...READ MORE

Jul 17, 2019 in Data Analytics by likitha
708 views
0 votes
1 answer

Change the order of legend values in a plot in R

@prardhana, Use scale_fill/color/size_discrete/contin....(labels = c()). compare both to see ...READ MORE

answered Nov 4, 2019 in Data Analytics by payal
1,958 views
0 votes
1 answer

Changing the order of bars in a bar-plot - ggplot2 - R

You can use the scale_x_discrete() function with ...READ MORE

answered May 28, 2018 in Data Analytics by Bharani
• 4,660 points
9,700 views
+1 vote
1 answer

Is it possible to change the column names of the dataset that I'm using in R?

That is definitely possible in R. You ...READ MORE

answered Dec 17, 2018 in Data Analytics by Anisha

edited Dec 17, 2018 1,669 views
0 votes
1 answer

How to plot side-by-side Plots with ggplot2 in R?

By Using gridExtra library we can easily ...READ MORE

answered Apr 16, 2018 in Data Analytics by DeepCoder786
• 1,720 points

edited Jun 9, 2020 by MD 8,804 views
0 votes
1 answer
0 votes
0 answers

Chart/plot to show 3 dimensions in a chart - R

Hi, I want to show chart with ...READ MORE

Jul 12, 2019 in Data Analytics by kalyan
528 views
0 votes
1 answer

Create a dual axis column/bar chart using ggplot in R

Add position = "stack" in geom_bar() function ...READ MORE

answered Nov 4, 2019 in Data Analytics by sindhu
4,577 views
0 votes
2 answers

Change the default order of labels of factor in R

You can also use relevel() to change ...READ MORE

answered Jun 27, 2019 in Data Analytics by sindhu
2,963 views
+1 vote
3 answers

How to change the value of a variable using R programming in a data frame?

Try this: df$symbol <- as.character(df$symbol) df$symbol[df$sym ...READ MORE

answered Jan 11, 2019 in Data Analytics by Tyrion anex
• 8,700 points
35,750 views
webinar REGISTER FOR FREE WEBINAR X
REGISTER NOW
webinar_success Thank you for registering Join Edureka Meetup community for 100+ Free Webinars each month JOIN MEETUP GROUP