Forecast using R in Tableau

0 votes
Show forecast of data using R in Tableau.
Jun 19, 2019 in Tableau by cherukuri sindhu
1,928 views

1 answer to this question.

0 votes

Let me explain using example forecast of profit over date.

Follow the below steps:

1. Create a calculative field to fetch dates already existing in dataset + values till Forecast date.
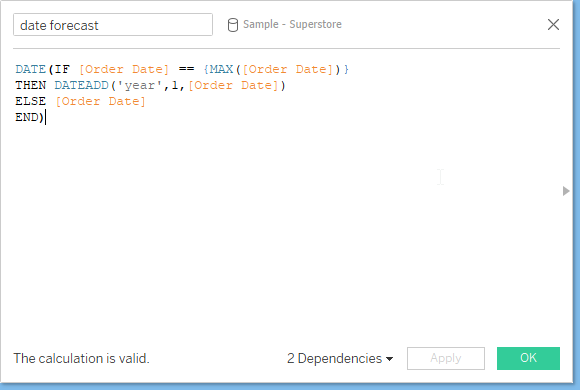
2. Create a forecast calculated field to create a forecast of data till the required date using the above created field.
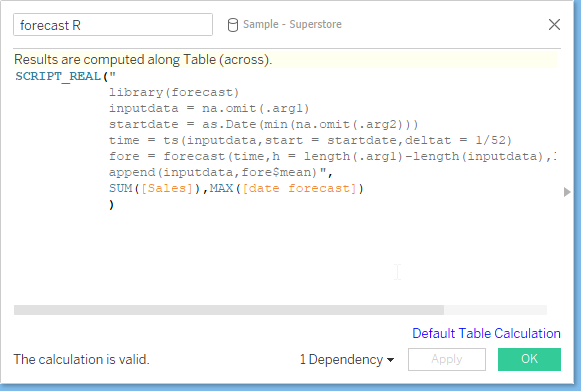
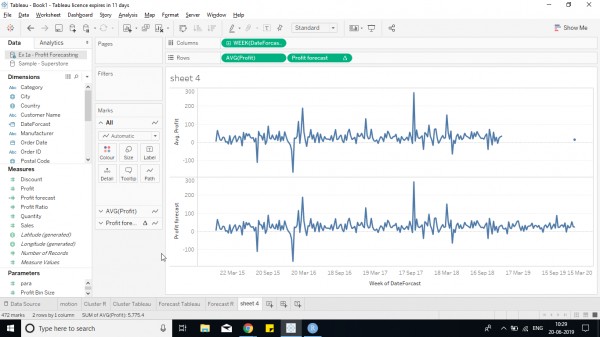
3. Now drop the date field created in step 1 in column shelf and field created in step2 in row shelf.
Thanks to TableauHQ for his explanation.

https://www.edureka.co/tableau-certification-training

answered Jun 21, 2019 by Cherukuri
• 33,030 points

Related Questions In Tableau

0 votes
1 answer

How can I calculate the median of sales price using 3 variables in Tableau

First let me clarify things for you. ...READ MORE

answered Apr 12, 2018 in Tableau by xyz
• 1,560 points
7,051 views
0 votes
1 answer

Using Regex in Tableau, but only getting Null values.

Tableau regex engine is ICU, and there ...READ MORE

answered Aug 17, 2018 in Tableau by AwesomeSauce
• 860 points
926 views
0 votes
1 answer

Is it possible to create a hierarchy drill down using pie charts in Tableau

Hey Gowri, Regarding your doubt, you can go ...READ MORE

answered Feb 17, 2020 in Tableau by Gitika
• 65,770 points
2,044 views
0 votes
0 answers

Using Python and Tableau in conjunction with one another

Is it possible to mix Python visualisations ...READ MORE

Feb 28, 2022 in Tableau by Vaani
• 7,070 points
523 views
0 votes
0 answers

pre-requisites to learn Tableau and R

What are the pre-requisites to learn Tableau ...READ MORE

May 10, 2018 in Tableau by GandalfDwhite
• 1,320 points
481 views
0 votes
1 answer

Setup R in Tableau

Follow the below steps: 1. Install R studio from ...READ MORE

answered Jun 20, 2019 in Tableau by Cherukuri
• 33,030 points
826 views
0 votes
1 answer

Error: package or namespace load failed for ‘mvoutlier’

Hi Sindhu, The error tells that JAGS .exe ...READ MORE

answered Jun 20, 2019 in Tableau by Cherukuri
• 33,030 points
1,229 views
0 votes
1 answer

Clustering using R and Tableau

Let me explain with a simple explanation ...READ MORE

answered Jun 20, 2019 in Tableau by Cherukuri
• 33,030 points
1,692 views
0 votes
1 answer
0 votes
1 answer

Find outliers in data using R in tableau

Hi Nithin, Follow the below steps: 1. Connect to ...READ MORE

answered Jun 20, 2019 in Tableau by Cherukuri
• 33,030 points
2,325 views
webinar REGISTER FOR FREE WEBINAR X
REGISTER NOW
webinar_success Thank you for registering Join Edureka Meetup community for 100+ Free Webinars each month JOIN MEETUP GROUP