How can I rotate axis labels in R

0 votes
May 18, 2018 in Data Analytics by shams
• 3,670 points
1,867 views

1 answer to this question.

0 votes

library(ggplot2)
p <- data.frame(Day=c("2011-04-11", "2014-05-24","2004-01-12","2014-06-20","2010-08-07","2014-05-28"), Impressions=c(24010,15959,16107,21792,24933,21634),Clicks=c(211,106,248,196,160,241))
p

         Day Impressions Clicks
1 2011-04-11       24010    211
2 2014-05-24       15959    106
3 2004-01-12       16107    248
4 2014-06-20       21792    196
5 2010-08-07       24933    160
6 2014-05-28       21634    241

p$Day <- strptime(p$Day,"%Y-%m-%d") #formatting into Date 
q <- ggplot(p, aes(x=Day,y=Clicks)) + geom_line()
q
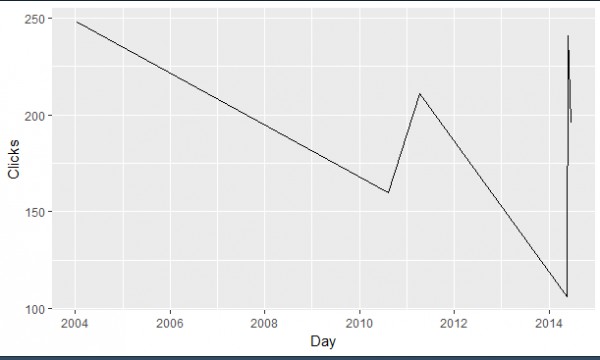

q + theme(axis.text.x = element_text(angle = 60, hjust = 1))
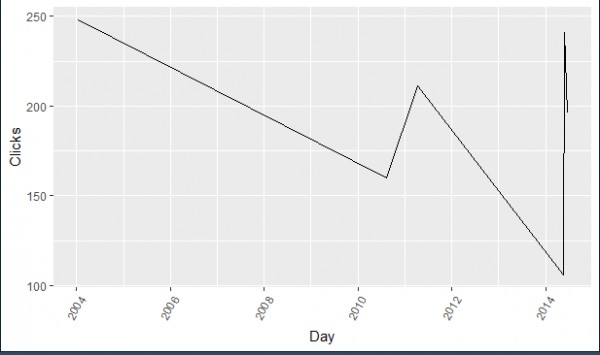
Thus, you can rotate labels for both X and Y axis in the similar way.

answered May 18, 2018 by zombie
• 3,790 points

Related Questions In Data Analytics

0 votes
1 answer

How can I define Global Variables in R?

The variables declared inside a function are ...READ MORE

answered Apr 25, 2018 in Data Analytics by shams
• 3,670 points
5,966 views
0 votes
1 answer

How can I delete multiple values from a vector in R?

The %in% operator tells  which elements are ...READ MORE

answered Apr 27, 2018 in Data Analytics by shams
• 3,670 points
6,159 views
0 votes
1 answer

How can I remove duplicated rows in R ?

The function distinct() in the dplyr package ...READ MORE

answered Apr 27, 2018 in Data Analytics by shams
• 3,670 points
2,954 views
0 votes
1 answer

How can I control the size of points in an R scatterplot?

plot(variable, type='o' , pch=5, cex=.3) The pch argument ...READ MORE

answered May 3, 2018 in Data Analytics by shams
• 3,670 points
1,255 views
0 votes
1 answer

How can I select a CRAN mirror in R ?

There are many ways of doing so ...READ MORE

answered May 9, 2018 in Data Analytics by zombie
• 3,790 points
970 views
0 votes
1 answer

How can I get type of all variables in R?

It is a easy task and one ...READ MORE

answered May 22, 2018 in Data Analytics by zombie
• 3,790 points
1,095 views
0 votes
1 answer

How can I Split code over multiple lines in an R script?

You can do this as follows: setwd(paste("~/a/very/long/path/here ...READ MORE

answered May 22, 2018 in Data Analytics by zombie
• 3,790 points
1,964 views
0 votes
1 answer

How can I find file name from full file path in R?

You can use: basename("C:/some_dir/filename.ext") # [1] "filename. ...READ MORE

answered May 24, 2018 in Data Analytics by zombie
• 3,790 points
1,317 views
0 votes
1 answer

How can I add x and y axis labels in ggplot2 ?

# Load a dataset(to work with) # We’ll ...READ MORE

answered May 16, 2018 in Data Analytics by zombie
• 3,790 points
1,055 views
0 votes
1 answer

How can I increase the number of axis ticks in R ?

You can try to override ggplots default ...READ MORE

answered May 30, 2018 in Data Analytics by zombie
• 3,790 points
6,725 views
webinar REGISTER FOR FREE WEBINAR X
REGISTER NOW
webinar_success Thank you for registering Join Edureka Meetup community for 100+ Free Webinars each month JOIN MEETUP GROUP