Power BI TopN and All Other

+1 vote

Hi, i want to categorize the data into top n data and others. how to do it? can anyone help me.

Year    Location    Type    Amount
2015    West        Apple   12
2015    West        Pear    14
2015    East        Apple   55
2015    South       Orange  62
2015    West        Orange  64
2015    East        Banana  12
2015    North       Banana  23
2015    East        Peach   43
2015    East        Apple   89
2015    West        Banana  77
2015    West        Orange  43
2015    North       Apple   2
Here i want to categorize data into top n depending on amount for each type.
Mar 18, 2019 in Power BI by Nithin
5,604 views

1 answer to this question.

+1 vote

Hi ,

  • Create a measure to calculate rank using below code.

           Rank = RANKX(ALLSELECTED(Sheet1[Type]),CALCULATE(SUM(Sheet1[Amount])),,DESC,Dense)

          ( Here the selecting all data for type in sheet1 and then calculating sum and displaying the rank in descending order. )

  • Then create another measure to group the top n as "Top N" others into "Others" group.

            group = IF([Rank]<=Parameter[Parameter Value],"Top N","OTHERS")

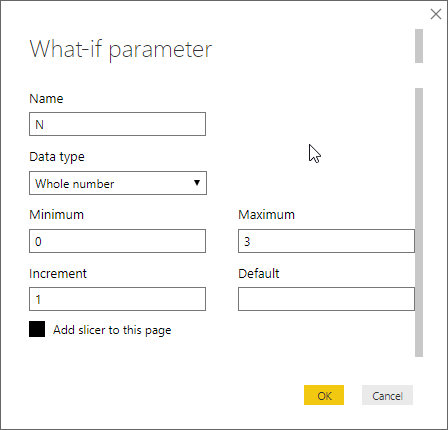
  • Add a parameter for selecting n value.​


  • Then click ok. Now drag the pointer on the slicer for selecting n value.
  • Then add the column for displaying top n and others as a column.
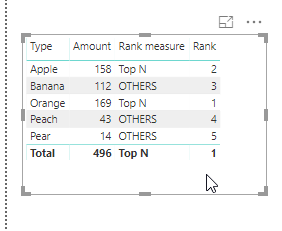
          

     Hope this helps you.

answered Mar 18, 2019 by Cherukuri
• 33,030 points
Cherukuri

Your solution looks quite good for me, however; is it possible to show the Type for Top N and Others for others
for example :  

Aple 158

Orange 169

Others 169

Thank you

See this blog below. It has good explanation on how to show top N and others group.

https://www.proserveit.com/blog/ms-power-bi-topn-and-other

Thank you, I did try following the link you sent to me .
It looked 90% fine for me , except that I'd like to show the table

Aple 158
Orange 169
Others 169

=========

Total  496

Now it shows the total of 327 (Because of the filter of Rank >0). Do you have any idea if it can really show the Net Total of TopN+Others.  I was a tableau user,  it is simply just building "Set" of Top N . While I am looking for this feature in power bi and does not find one.

Thank you

Related Questions In Power BI

0 votes
0 answers
+1 vote
1 answer

Unable to install connector for Power Bi and PostgreSQL

I think the problem is not at ...READ MORE

answered Aug 22, 2018 in Power BI by nirvana
• 3,130 points
2,479 views
+1 vote
1 answer

Connect power bi desktop to dataset and create custom reports

Yes using Power BI REST API to ...READ MORE

answered Sep 18, 2018 in Power BI by Kalgi
• 52,360 points
1,439 views
+3 votes
2 answers

Combine tables in Power BI

You can also achieve this using a ...READ MORE

answered Oct 5, 2018 in Power BI by lina
• 8,220 points

edited Oct 11, 2018 by Kalgi 2,129 views
0 votes
1 answer

Power Bi Dax Table

You need to wrap the numbers in ...READ MORE

answered Oct 5, 2018 in Power BI by Kalgi
• 52,360 points
950 views
0 votes
2 answers

Power BI Dax Multiple IF AND Statements

HI I have Column Patient 12 13 14 15 18 IN Patient=12, 13 Out ...READ MORE

answered May 23, 2019 in Power BI by VNK
18,469 views
0 votes
1 answer

Distinct count filtered by condition using Power BI Dax

Try this, it should work: DistinctCountActiveMonths = CALCULATE( ...READ MORE

answered Oct 5, 2018 in Power BI by Kalgi
• 52,360 points
36,985 views
0 votes
1 answer

How to categorize state, pin and city in power bi (Address)

After loading dataset, you can split in ...READ MORE

answered May 10, 2019 in Power BI by anonymous
• 33,030 points
2,958 views
0 votes
1 answer

Difference between measure and calculate column in power BI

Hi Rahul,  With calculated columns, you can add new ...READ MORE

answered May 17, 2019 in Power BI by Cherukuri
• 33,030 points
10,298 views
webinar REGISTER FOR FREE WEBINAR X
REGISTER NOW
webinar_success Thank you for registering Join Edureka Meetup community for 100+ Free Webinars each month JOIN MEETUP GROUP