Displaying Aggregations across bar chart in Tableau

0 votes
How to display multiple aggregation values on a bar chart?
Mar 8, 2019 in Tableau by Sindhu
2,160 views

1 answer to this question.

0 votes

Hi Sindhu,

1.You can use average lines to show multiple aggregation values.

2. Plot a bar graph as per requirement, then click on analysis pane.

3. Drag and drop average line across Pane / Cell / Table.
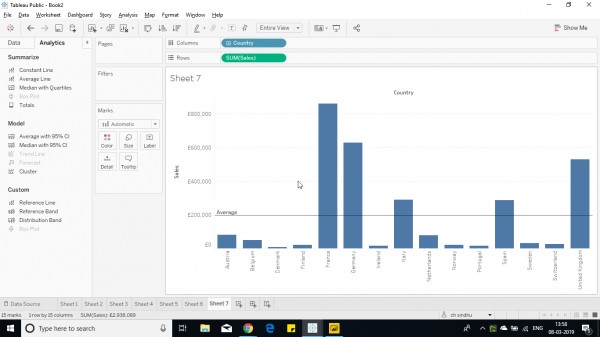
4. If there ate multiple panes then go for pane to show aggregations of individual panes else select table to show aggregation of complete table.

5.Right click on the line to edit the line.

6. Edit the dialog box as per requirement.
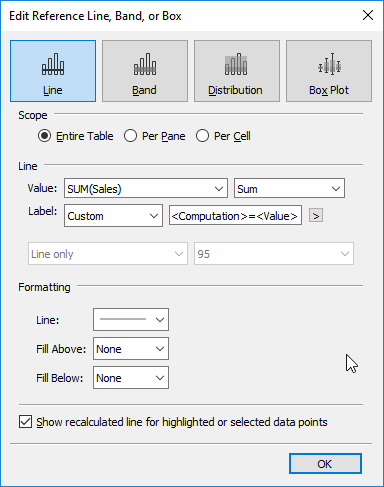
7. Edit the labels as required and click ok.

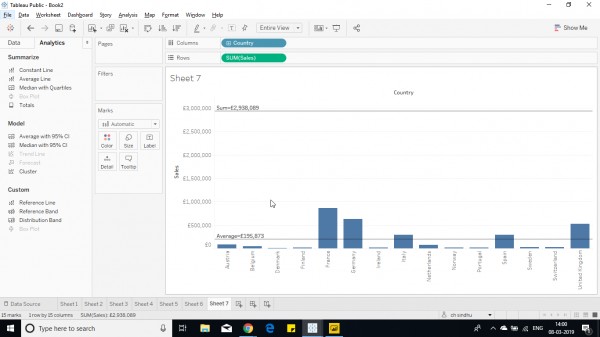
8. Create multiple lines to show each aggregation by editing the lines as above by selecting different aggregation functions from drop down.

This way multiple aggregated values can be shown in a bar chart.
Hope this helps you.

answered Mar 8, 2019 by Cherukuri
• 33,030 points

Related Questions In Tableau

0 votes
1 answer

Creating a dual axis chart with same measure in Tableau

Yes, this is possible. Drop the measure in ...READ MORE

answered May 29, 2018 in Tableau by Atul
• 10,240 points
8,795 views
+1 vote
1 answer

Non-overlaid measures in dual axis chart within Tableau

The missing step is to specify the ...READ MORE

answered Jul 24, 2018 in Tableau by Atul
• 10,240 points
872 views
0 votes
1 answer

How to add grand totals of the bar in Stacked Bar in Tableau

Hi Grim, As you have used reference line ...READ MORE

answered Sep 24, 2018 in Tableau by Machdata
• 340 points
5,348 views
0 votes
1 answer

average line on chart of averages

Hi Anitha, To add average line already aggregated ...READ MORE

answered Apr 23, 2019 in Tableau by Cherukuri
• 33,030 points
1,008 views
0 votes
1 answer

How can I count the aggregate function in Tableau

Create two calculated fields one for 100's ...READ MORE

answered Apr 6, 2018 in Tableau by Atul
• 10,240 points
5,685 views
0 votes
1 answer

How to aggregate multiple column in Tableau?

You can use Tableau’s inbuilt pivot method ...READ MORE

answered Jul 10, 2018 in Tableau by ffdfd
• 5,550 points
2,758 views
0 votes
1 answer

Want to hide the Bar for Grand Total in the bar chart in Tableau

Tableau treats the whole visualization uniformly.  If you ...READ MORE

answered Aug 10, 2018 in Tableau by AwesomeSauce
• 860 points
3,853 views
0 votes
1 answer

In Tableau, how to pass measure/dimension to action filters that are not in the chart?

Hi Sindhu,  You can choose the fields that are ...READ MORE

answered Mar 11, 2019 in Tableau by Cherukuri
• 33,030 points
5,596 views
0 votes
1 answer

How to show percentages on the slices in pie chart in Tableau?

Hi sindhu, You can manually move the labels ...READ MORE

answered Mar 13, 2019 in Tableau by Cherukuri
• 33,030 points
11,776 views
webinar REGISTER FOR FREE WEBINAR X
REGISTER NOW
webinar_success Thank you for registering Join Edureka Meetup community for 100+ Free Webinars each month JOIN MEETUP GROUP