problem with tabitems in shiny R

+1 vote

I’m trying to create a dashboard using shiny R. this is my ui.R and server.R files

Ui.R
library(shiny)
library(shinydashboard)
shinyUI(
  dashboardPage(
    dashboardHeader(title="Edureka"),
    dashboardSidebar(
      sliderInput("bins","number of breaks",1,100,50),
      menuItem("Monthly Sales",tabName = "dashboard"),
    menuSubItem("DevOps",tabName = "DevOps"),
    menuSubItem("Blockchain",tabName = "Blockchain"),
    menuSubItem("AWS",tabName = "AWS"),
    menuItem("Finance Dashboard"),
    menuSubItem("Revenue Generated",tabName = "Revenue"),
    menuSubItem("Company Expenditure",tabName = "Expenditure")),
    dashboardBody(
      tabItems(
        tabItem(abName = "dashboard",
        fluidRow(
          box(plotOutput("$histogram")))
        ),
        tabItem(tabName = "DevOps",
            h1("DevOps courses sold")
         ),
        tabItem(tabName = "Blockchain",
                h1("Blockchain courses sold")
                ),
        tabItem(tabName = "AWS",
                h1("AWS Courses sold")
                )),
        tabItem(tabName = "Revenue", h1("Revenue Generated")),
        tabItem(tabName = "Expenditure",h1("Company Expenditures"))
      )
    )
)
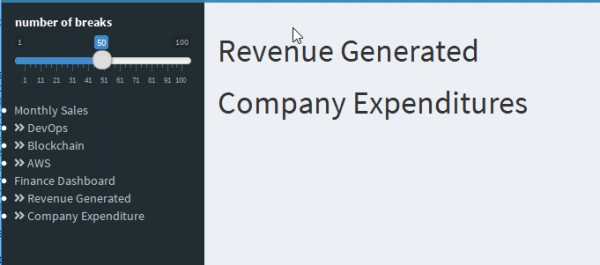

I want revenue generated and company expenditure in revenue generated and company expenditure section under finance dashboard.

Nov 30, 2018 in Data Analytics by Ali
• 11,360 points
1,912 views

1 answer to this question.

0 votes
Check your braces. Code tabitems after aws and start another tabitems and add two tabitem under it for revenue generated and expenditure.
answered Nov 30, 2018 by Maverick
• 10,840 points

Related Questions In Data Analytics

+5 votes
0 answers
+2 votes
3 answers

Problem with installation of Wordcloud in anaconda

Using Anaconda Python 3.6 version For Windows ...READ MORE

answered Aug 7, 2018 in Data Analytics by Priyaj
• 58,020 points
18,736 views
0 votes
1 answer

How to plot side-by-side Plots with ggplot2 in R?

By Using gridExtra library we can easily ...READ MORE

answered Apr 16, 2018 in Data Analytics by DeepCoder786
• 1,720 points

edited Jun 9, 2020 by MD 8,874 views
0 votes
1 answer

How to print new lines with print() in R?

You can use cat() instead of writeLines(): ...READ MORE

answered May 3, 2018 in Data Analytics by kappa3010
• 2,090 points
899 views
+1 vote
1 answer

Error saying "could not find function "shinyUI"" in shiny R

Its a small spelling mistake that you've ...READ MORE

answered Nov 28, 2018 in Data Analytics by Maverick
• 10,840 points
2,646 views
+1 vote
1 answer

Error saying "could not find function dashboardPage" in shiny R

Include this line in the code: Library(shinydashboard) READ MORE

answered Nov 29, 2018 in Data Analytics by Maverick
• 10,840 points
3,697 views
0 votes
1 answer

Error saying "Error in rnorm() : argument "n" is missing, with no default" in R

Hey @ali, rnorm() function requires an argument, ...READ MORE

answered Oct 30, 2018 in Data Analytics by Maverick
• 10,840 points
3,348 views
0 votes
1 answer

Creating barplot with standard errors plotted in R

For df1 plot # Group data by when ...READ MORE

answered Nov 12, 2018 in Data Analytics by Maverick
• 10,840 points
1,205 views
webinar REGISTER FOR FREE WEBINAR X
REGISTER NOW
webinar_success Thank you for registering Join Edureka Meetup community for 100+ Free Webinars each month JOIN MEETUP GROUP