I worked on a project in R a while back that did something pretty similar. Here's an example of a video demonstrating the proof-of-concept (no audio). It effectively depicts the ultimate result of using Tableau to interactively explore wine descriptions in a word cloud for the chosen nations. The following were the most important elements:
Tableau connects to the data to be analysed, as well as a placeholder dataset containing the number of records you anticipate to get from your Python/R code (Tableau expects to receive the same number of records back from Python/R as it sends forth to be processed). It can be a problem if you're transmitting text data but processing it to produce a large number of records (as in the word cloud example).
The Word and Frequency counts are returned in a single vector, separated by a delimiter, by Python/R code that connects to your data (what Tableau will require for a word cloud).
Tableau Calculated Fields are used to split the single vector and parameter actions are used to pick parameter values to pass to the Python/R code.
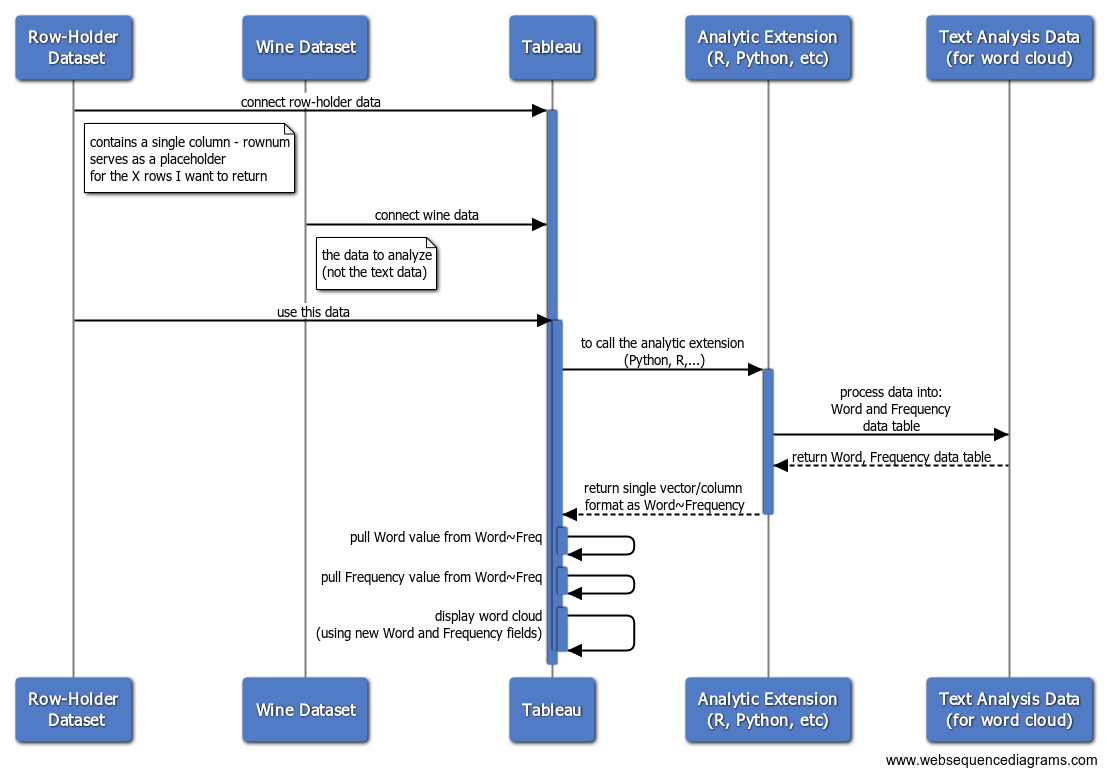
Tableau Calculated Field - [R Words+Freq]:
Script_Str('
print("STARTING NEW SCRIPT RUN")
print(Sys.time())
print(.arg2) # grouping
print(.arg1) # selected country


# TEST VARIABLE (non-prod)
.MaxSourceDataRecords = 1000 # -1 to disable

# TABLEAU PARAMETER VARIABLES
.country = "' + [Country Parameter] + '"
.wordsToReturn = ' + str([Return Top N Words]) + '
#^^^^^^^^^^^^^^^^^^^^^^^^^^^^^^^^^^^^^^^^^^^^^^^^^^^#

# VARIABLES DERIVED FROM TABLEAU PARAMETER VALUES
.countryUseAll = (.country == "All")
print(.countryUseAll)
#^^^^^^^^^^^^^^^^^^^^^^^^^^^^^^^^^^^^^^^^^^^^^^^^^^^#

#setwd("C:/Users/jbelliveau/....FILL IN HERE...")
.fileIn = ' + [Source Data Path] + '
#.fileOut = "winemag-with-DTM.csv"

#install.packages("wordcloud")
#install.packages("RColorBrewer") # not needed if installed wordcloud package

library(tm)
library(wordcloud)
library(RColorBrewer) # color package (maps or wordclouds)

wineAll = read.csv(.fileIn, stringsAsFactors=FALSE)

# TODO separately... polarity

# use all the data or just the parameter selected
print(.countryUseAll)

if ( .countryUseAll ) {
  wine = wineAll # filter down to parameter passed from Tableau
}else{
  wine = wineAll[c(wineAll$country == .country),] # filter down to parameter passed from Tableau
}

# limited data for speed (NOT FOR PRODUCTION)
if( .MaxSourceDataRecords > 0 ){
  print("limiting the number of records to use from input data")
  wine = head(wine, .MaxSourceDataRecords)
}


corpus = Corpus(VectorSource(wine$description))
corpus = tm_map(corpus, tolower)
#corpus = tm_map(corpus, PlainTextDocument)
corpus = tm_map(corpus, removePunctuation)
corpus = tm_map(corpus, removeWords, stopwords("English"))
#length(corpus)

dtm = DocumentTermMatrix(corpus)

#?sample
mysample = dtm # no sampling (used Head on data read... for speed/simplicity on this example)
#mysample <- dtm[sample(1:nrow(dtm), 5000, replace=FALSE),]
#nrow(mysample)
wineSample = as.data.frame(as.matrix(mysample))

# column names (the words)
# use colnames to get a vector of the words
#colnames(wineSample)

# freq of words
# colSums to get the frequency of the words
#wineWordFreq = colSums(wineSample)

# structure in a way Tableau will like it
wordCloudData = data.frame(words=colnames(wineSample), freq=colSums(wineSample))
str(wordCloudData)

# sort by word freq
wordCloudDataSorted = wordCloudData[order(-wordCloudData$freq),]

# join together by ~ for processing once Tableau gets it
wordAndFreq = paste(wordCloudDataSorted[, 1], wordCloudDataSorted[, 2], sep = "~")

#write.table(wordCloudData, .fileOut, sep=",",row.names=FALSE) # if needed for performance refactors

topWords = head(wordAndFreq, .wordsToReturn)
#print(topWords)

return( topWords )

',
Max([Country Parameter])
, MAX([RowNum]) // for testing the grouping being sent to R
)
Tableau Calculated Field for the Word Value:
// grab the first token to the left of ~
Left([R Words+Freq], Find([R Words+Freq],"~") - 1)
Tableau Calculated Field for the Frequency Value:
INT(REPLACE([R Words+Freq],[Word]+"~",""))
If you're not familiar with Tableau, you'll probably want to work with someone who is. They'll be able to assist you with creating calculated fields and connecting Tableau to TabPy.


