A relationship with a many-many cardinality in Power BI Desktop is composed of one of three related features:
-
Composite models: A composite model allows a report to have two or more data connections, including DirectQuery connections or Import, in any combo. For more information, see Use composite models in Power BI Desktop.
-
Relationships with a many-many cardinality: With composite models, you can establish relationships with a many-many cardinality between tables. This approach removes requirements for unique values in tables. It also removes previous workarounds, such as introducing new tables only to establish relationships. The feature is described further in this article.
-
Storage mode: You can now specify which visuals require a query to back-end data sources. Visuals that don't require a query are imported even if they're based on DirectQuery. This feature helps improve performance and reduce back-end load. Previously, even simple visuals, such as slicers, began queries that were sent to back-end sources. For more information, see Storage mode in Power BI Desktop.
What a relationship with a many-many cardinality solves
Before relationships with a many-many cardinality became available, the relationship between two tables was defined in Power BI. At least one of the table columns involved in the relationship had to contain unique values. Often, though, no columns contained unique values.
For example, two tables might have had a column labeled Country. The values of Country weren't unique in either table, though. To join such tables, you had to create a workaround. One workaround might be to introduce extra tables with the needed unique values. With relationships with a many-many cardinality, you can join such tables directly, if you use a relationship with a cardinality of many-to-many.
Use relationships with a many-many cardinality
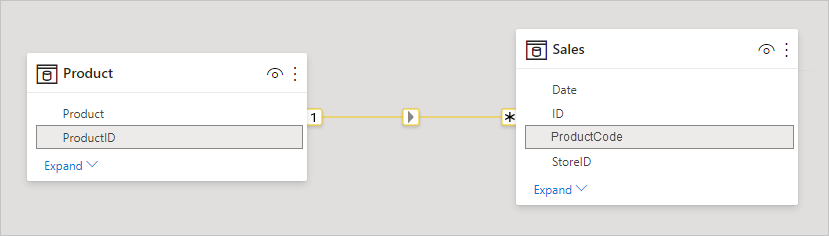
When you define a relationship between two tables in Power BI, you must define the cardinality of the relationship. For example, the relationship between ProductSales and Product—using columns ProductSales[ProductCode] and Product[ProductCode]—would be defined as Many-1. We define the relationship in this way, because each product has many sales, and the column in the Product table (ProductCode) is unique. When you define a relationship cardinality as Many-1, 1-Many, or 1-1, Power BI validates it, so the cardinality that you select matches the actual data.
For example, take a look at the simple model in this image:
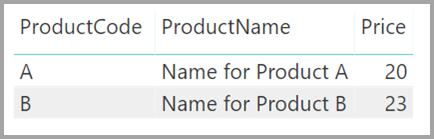
Now, imagine that the Product table displays just two rows, as shown:
Also imagine that the Sales table has just four rows, including a row for a product C. Because of a referential integrity error, the product C row doesn't exist in the Product table.

The ProductName and Price (from the Product table), along with the total Qty for each product (from the ProductSales table), would be displayed as shown:
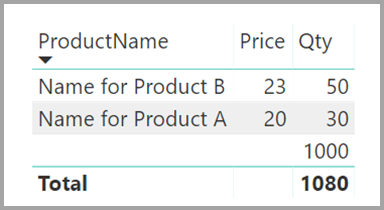
As you can see in the preceding image, a blank ProductName row is associated with sales for product C. This blank row accounts for the following:
-
Any rows in the ProductSales table for which no corresponding row exists in the Product table. There's a referential integrity issue, as we see for product C in this example.
-
Any rows in the ProductSales table for which the foreign key column is null.
For these reasons, the blank row in both cases accounts for sales where the ProductName and Price are unknown.
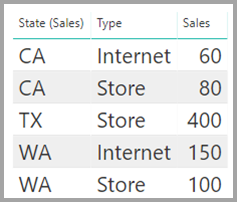
Sometimes the tables are joined by two columns, yet neither column is unique. For example, consider these two tables:
-
The Sales table displays sales data by State, and each row contains the sales amount for the type of sale in that state. The states include CA, WA, and TX.
-
The CityData table displays data on cities, including the population and state (such as CA, WA, and New York).

A column for State is now in both tables. It's reasonable to want to report on both total sales by state and total population of each state. However, a problem exists: the State column isn't unique in either table.
The previous workaround
Before the July 2018 release of Power BI Desktop, you couldn't create a direct relationship between these tables. A common workaround was to:
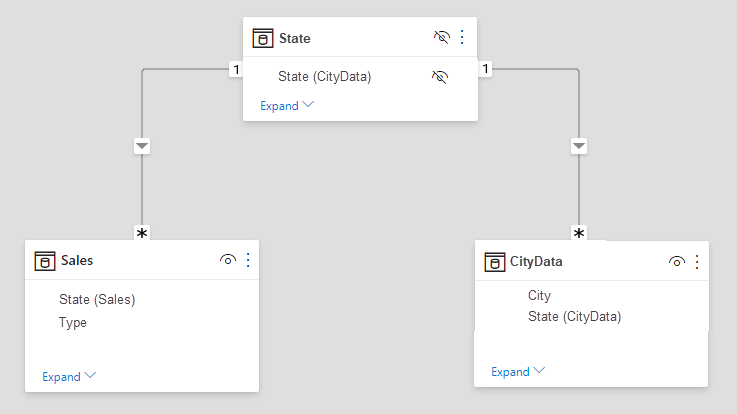
You could leave the workaround table visible. Or you may hide the workaround table, so it doesn't appear in the Fields list. If you hide the table, the Many-1 relationships would commonly be set to filter in both directions, and you could use the State field from either table. The later cross filtering would propagate to the other table. That approach is shown in the following image:
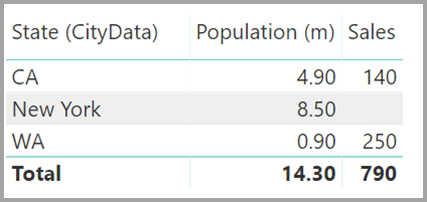
A visual that displays State (from the CityData table), along with total Population and total Sales, would then appear as follows:
Note
Because the state from the CityData table is used in this workaround, only the states in that table are listed, so TX is excluded. Also, unlike Many-1 relationships, while the total row includes all Sales (including those of TX), the details don't include a blank row covering such mismatched rows. Similarly, no blank row would cover Sales for which there's a null value for the State.
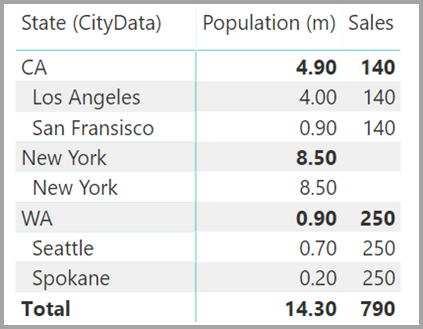
Suppose you also add City to that visual. Although the population per City is known, the Sales shown for City simply repeats the Sales for the corresponding State. This scenario normally occurs when the column grouping is unrelated to some aggregate measure, as shown here:
Let's say you define the new Sales table as the combination of all States here, and we make it visible in the Fields list. The same visual would display State (on the new table), the total Population, and total Sales:
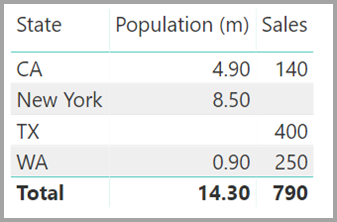
As you can see, TX—with Sales data but unknown Population data—and New York—with known Population data but no Sales data—would be included. This workaround isn't optimal, and it has many issues. For relationships with a many-many cardinality, the resulting issues are addressed, as described in the next section.
Use a relationship with a many-many cardinality instead of the workaround
You can directly relate tables, such as the ones we described earlier, without having to resort to similar workarounds. It's now possible to set the relationship cardinality to many-to-many. This setting indicates that neither table contains unique values. For such relationships, you may still control which table filters the other table. Or you can apply bidirectional filtering, where each table filters the other.
In Power BI Desktop, the cardinality defaults to many-to-many when it determines neither table contains unique values for the relationship columns. In such cases, a warning message confirms you want to set a relationship, and the change isn't the unintended effect of a data issue.
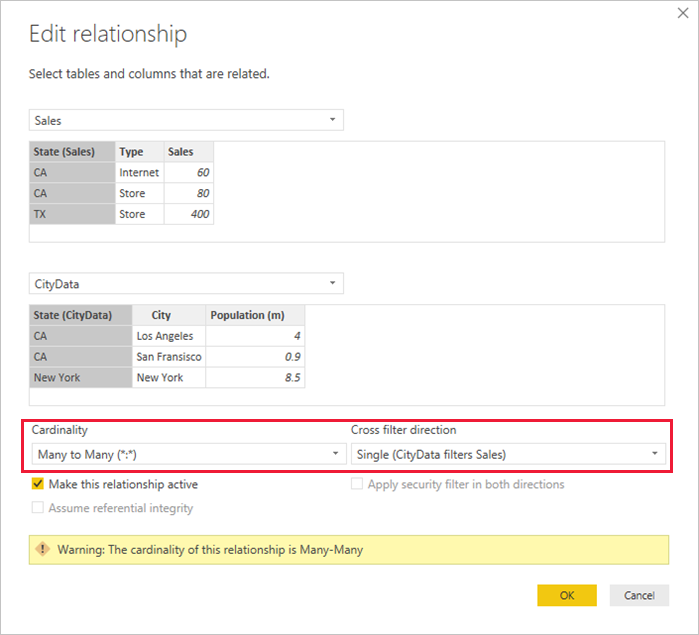
For example, when you create a relationship directly between CityData and Sales—where filters should flow from CityData to Sales—Power BI Desktop displays the Edit relationship dialog box:
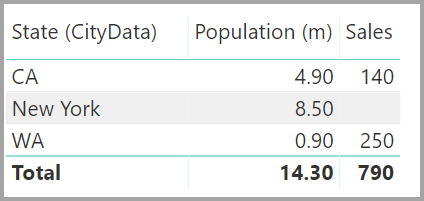
The resulting Relationship view would then display the direct, many-to-many relationship between the two tables. The tables' appearance in the Fields list, and their later behavior when the visuals are created, are similar to when we applied the workaround. In the workaround, the extra table that displays the distinct State data isn't made visible. As described earlier, a visual that shows State, Population, and Sales data would be displayed:
The major differences between relationships with a many-many cardinality and the more typical Many-1 relationships are as follows:
-
The values shown don't include a blank row that accounts for mismatched rows in the other table. Also, the values don't account for rows where the column used in the relationship in the other table is null.
-
You can't use the RELATED() function, because more than one row could be related.
-
Using the ALL() function on a table doesn't remove filters that are applied to other, related tables by a many-to-many relationship. In the preceding example, a measure that's defined as shown here wouldn't remove filters on columns in the related CityData table:

A visual showing State, Sales, and Sales total data would result in this graphic:
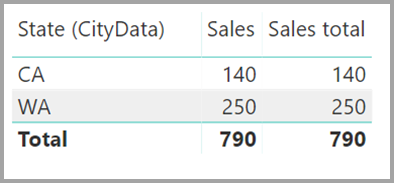
With the preceding differences in mind, make sure the calculations that use ALL(<Table>), such as % of grand total, are returning the intended results.
Considerations and limitations
There are a few limitations for this release of relationships with a many-many cardinality and composite models.
The following Live Connect (multidimensional) sources can't be used with composite models:
- SAP HANA
- SAP Business Warehouse
- SQL Server Analysis Services
- Power BI datasets
- Azure Analysis Services
When you connect to these multidimensional sources by using DirectQuery, you can't connect to another DirectQuery source or combine it with imported data.
The existing limitations of using DirectQuery still apply when you use relationships with a many-many cardinality. Many limitations are now per table, depending upon the storage mode of the table. For example, a calculated column on an imported table can refer to other tables, but a calculated column on a DirectQuery table can still refer only to columns on the same table. Other limitations apply to the whole model if any tables within the model are DirectQuery. For example, the QuickInsights and Q&A features are unavailable on a model if any table within it has a storage mode of DirectQuery.
Unlock the Power of Data Visualization with Our Comprehensive Power BI Course!
Also Read:
What strategies do you use for writing efficient DAX code to handle large fact tables with millions of rows?


