Hi Preethi,
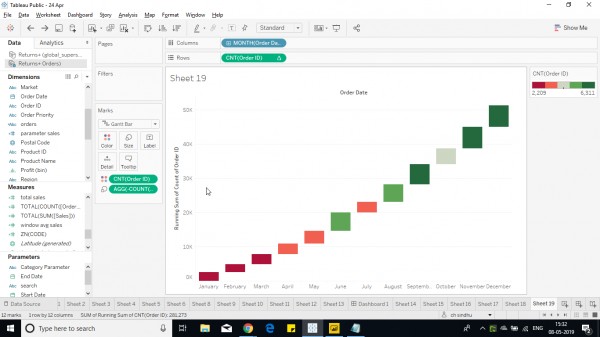
Follow the below steps:
1. Create a bar chart with count(orders) and year on the sheet.
2. Now convert the count(orders) and add quick calculation as running total. change the graph to Gantt under marks pane.
3. Now add the -count(order_id) in color shelf.
4. Add the count(order_id) in color shelf with stepped color to show increase or decrease of orders.

Hope it helps.
 REGISTER FOR FREE WEBINAR
X
 Thank you for registering
Join Edureka Meetup community for 100+ Free Webinars each month
JOIN MEETUP GROUP