Hi Anitha,
Follow below steps:
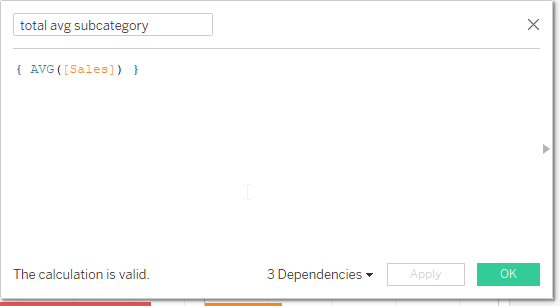
1. Create a calculated field to find the total avg for subcategory using Fixed LOD.
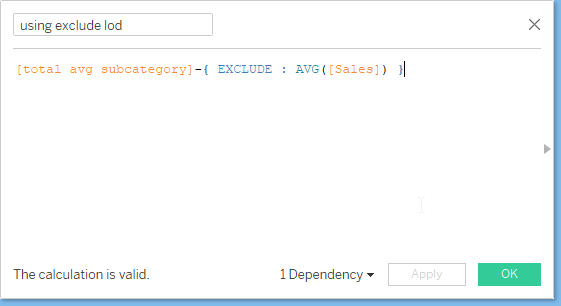
2. Create another calculated field to create comparison using Exclude LOD.
3. Now drop the above field and avg(sales) in the sheet.
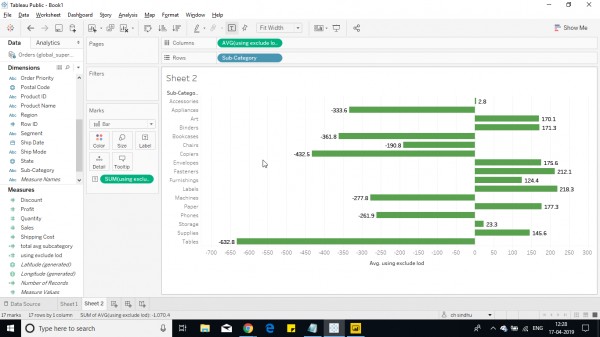
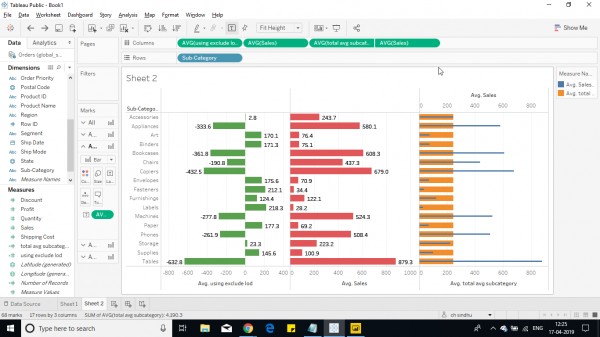
4. Drop avg(sales) in to label and below Chart would be shown. The image shows category sales and difference with respect to total average.
( Green bar shows required comparison using exclude lod and red shows avg for each subcategory )
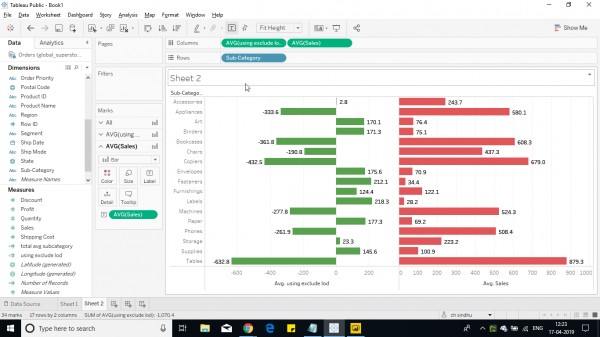
5. To show more difference i have also added a dual axis beside to show the comparison. ( Orange show the total avg and blue shows avg for each subcategory )
Hope this helps you.
 REGISTER FOR FREE WEBINAR
X
 Thank you for registering
Join Edureka Meetup community for 100+ Free Webinars each month
JOIN MEETUP GROUP