How to filter on multiple columns in single table

+1 vote
i have one requirement:

list of columns like(Reason1,Reson2,.....,Name,Calimid,Patient)

i have 10 columns(Reason1, Reason2,Reason3,Reason4........)  in single table. but conditions  reason1 =2 , for the claimid count or claimid values. i want show only 2 for all 10 columns.

Note: we need to show only Reason 2 claimid list,plz create any dax cal?
Jul 10, 2019 in Power BI by vnk
8,276 views
Are you saying you want to show only reason 2 and claim id whose reason 1= reason 2?
ex: Reason1 (1, 253,22,25,444,5,6)

     Reason2(22,5,253,90,567,346,1,34)

     Reason3(345,890,34,2,33,45,22,56)

     -----10 etc.

output: submittedclaimid,Reasoncode,SUM(Amount)

             12xvr,22,345

             2341,22,800

             2385xi,22,500

-------etc
Is amount also a column in your table?

You want to show sum of amount and distinct claimid for evry reason code in reason 2 column? Is this your question?
Yes. but we need to previous example of output.
hi i have 5 excel files data is there, we need scheduled to the excel in service/power bi.com. how do you scheduled the excel files daily basis 11 AM i possible or not.

Can you please explain details.
I'm sorry but I don't get your question.
1) is it scheduled refresh on Excel files data daily refresh in power bi service possible or not.

2) data is in cloud scheduled refresh is required or not

3) min to min scheduled refresh possible or not

Hi @vnk,

1. Scheduled refresh on excel file is possible in power bi service.

See this link to know how to schedule refresh data source file.

https://docs.microsoft.com/en-us/power-bi/refresh-scheduled-refresh

2. If data is stored in the cloud, if the source is a live connection to power bi then data is automatically refreshed.

Hi , i have 1 column Geolocation, how to show the visualization in our report(Map). in power BI Desktop?

ex:
GeoLocation
36.597976, -118.279711
38.693426, -119.353615
33.295516, -115.931996

 Can you please explain Details how to show the report.

hi , based on below data which kind of charts created time series charts.


Source
TagName DateTime Value Unit State Quality QualityStatus GeoLocation
MountainWaterTreatment Clearwell.pH 9/1/2019 0:00 7.9315 pH 192 Good 36.597976, -118.279711
MountainWaterTreatment Clearwell.pH 9/1/2019 0:10 7.931 pH 192 Good 36.597976, -118.279711
MountainWaterTreatment Clearwell.pH 9/1/2019 0:25 7.933 pH 192 Good 36.597976, -118.279711
MountainWaterTreatment Clearwell.pH 9/1/2019 2:00 7.932143 pH 192 Good 36.597976, -118.279711

how to create a time series chart in power bi?

How to create a dual kpi in power bi?
Need help on power bi Questions.

 1) How to create a Weekday in Datediff?

2) i have single visualization on sales. and 3 slicer, when i click on country by sales, State by sale, City by Sales it is automatically dynamic change in report. how to create it.

3) difference b/w Dateadd and Sameperiod lastyear with example.
Dateadd change or create new date values by add/subtracting day/month/year's Whereas sameperiodlastyear returns exact same date from last year.

Ex:

DATEADD(DateTime[Dates],-1,day)

SAMEPERIODLASTYEAR(DateTime[Dates])

@Vnk, 

I didn't understand your first question. But I tried to get as per your requirement in question 2.See the below images to see the dynamic change of sales depending on country/state/city.

Follow the below steps: 

1. Duplicate column Country, State, and City.

2. Unpivot the duplicated columns.

3. Create a slicer with Attribute and edit the slicer as required.

4. Drop Value field in Axis and Sales in Value as below.

I hope it helps!

Thank you so much.

first question is by using date diff create a weekdays possible or not?

ex: 20/09/2018 and 2/04/2016 (2 difference dates)

Glad to help @vnk.

I have no idea about it. But you can refer to this.

https://community.powerbi.com/t5/Desktop/DATEDIFF-Working-Days/td-p/130662

1)How do you Implement Incremental Refresh in Power BI and what are the necessary in services. explain details.

 - incremental refresh

- Fully Load

@vnk, 

https://www.edureka.co/community/58828/how-to-implement-incremental-refresh-in-power-bi

You do not need any services. If the number of rows in the dataset is within the maximum number of rows in Power BI Desktop, then the dataset can be fully loaded else you need to either filter or load a subset of the dataset. 

To load large data during incremental refresh, Power BI Desktop makes use of range parameters. Find the complete instructions here.

Thanks,

i have 2 requirements in power bi

1) in desktop User select  May Month it is showing  Previous 3 Month.how to create dax calculation?

Ex: Select May-- Display (March, Apr, May)

2) IN Service,Filter Month- Every Month automatic display the current Month , how to create?

Ex: now Current Month is Oct- Next Month is November; But November Month it is automatic showing  Nov month, user Not select the Nov month.is possible or Not?

1 answer to this question.

+1 vote

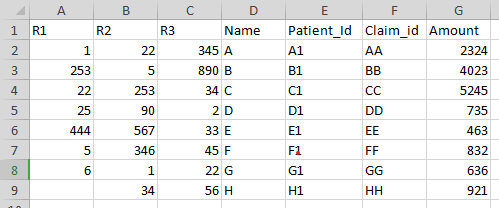
I used dummy data to show how to get the output like yours.

Dummy Data -  I took 4 Reasons to create a table.

Now Load the data into Power BI.

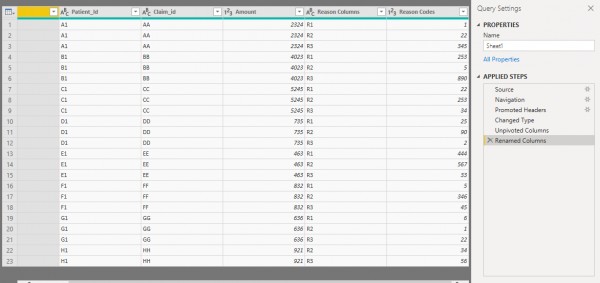
Then Click on All reason columns and click on unpivot columns to collect all reason codes in one Reason columns and Reason Codes field.
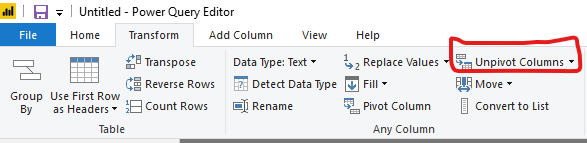
Like below - 

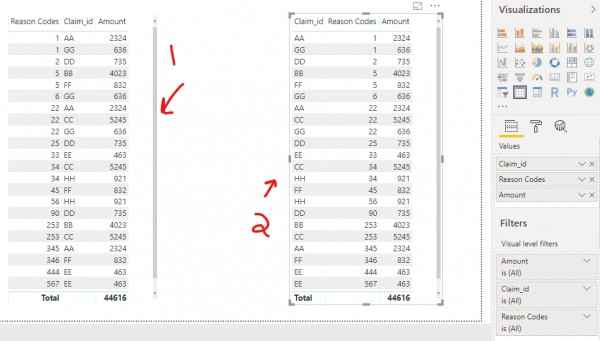
Apply and close the editor, Go to Power BI Desktop. Follow below steps:

1. Select table from Visualizations.

2. Select Reason codes, Claim_id and amount columns.

3. Click on arrow button next to Reason codes and select Dont Summarize instead of Sum.

4. The table will be shown as below.

answered Jul 11, 2019 by sindhu
Do you want to remove many to many relationship between tables?
No,we need to find the many to one relationship.but the count is matching for payers.

Hi, you can refer to this blog to deal with many to many and with many to one relationships.

https://docs.microsoft.com/en-us/power-bi/desktop-many-to-many-relationships

I do not know much about Many to many relationships in Power BI. It might help you.

thanks for your reply. NEw requirement:

i have one table, in table columns contains Master,claimid,billed,paid,servicecode,reasoncodeA1,AmountA1,quanityA1,,...etc we have 9 reasoncoden,Amountn,Quantityn coumns data available. see below columns

Master,Claimid,billed,Paid,servicecode,reasoncodeA1,AmountA1,QuantityA1,ReasoncodeA2,AmountA2,QuantityA2,ReasoncodeA3,AmountA3,QuantityA3,ReasoncodeB1,AmountB1,QuantityB1,ReasoncodeB2,AmountB2,QuantityB2,ReasoncodeB3,AmountB3,QuantityB3,ReasoncodeC1,AmountC1,QuantityC1,ReasoncodeC2,AmountC2,QuantityC2,ReasoncodeC3,AmountC3,QuantityC3.

123,10160623,400,200,Hv:2309,45,100,2,125,120,3,null,-120,4,22,10,1,125,400,20,null,null,null,2,null,1,45,100,2,16,1000,4

234,10160645,500,600,sv:28902,16,100,2,null,120,3,2,-120,4,125,10,1,45,400,20,46,200,null,16,null,1,167,100,2,35,1000,4------50 rows

example_output: Reasoncode by Claimidcount

we need Reasoncodes,Claimid

Null ,   10160623,10160645          

45 ,10160623 

125,10160623,10160645

22,10160623

2 ,10160623,10160645

16,10160645,10160623

167,10160645

 35 ,10160645 

46,10160645           

in power bi how to combine multiple columns in to single column, we do unpivot ..etc.

can you please correct answer.                 

Your question is converted as a new question. Kindly visit the below link.

https://www.edureka.co/community/52199/how-to-combine-multiple-columns-in-to-single-column

Related Questions In Power BI

+1 vote
1 answer

how to combine multiple columns in to single column?

1. Select Edit Queries 2.Select which column you ...READ MORE

answered Aug 6, 2019 in Power BI by anonymous
768 views
0 votes
3 answers

How to create final table based on Joins of two tables in power BI?

To do so, follow these steps: From the ...READ MORE

answered Dec 16, 2020 in Power BI by Gitika
• 65,910 points
53,496 views
0 votes
4 answers

How to combine multiple tables in power BI?

Click Advanced Editor and check if step #"Appended ...READ MORE

answered Dec 16, 2020 in Power BI by Roshni
• 10,520 points
69,289 views
0 votes
1 answer

How to add multiple reference lines on a bar/ column graph?

Hi, Follow below steps: 1. Add a bar/ column ...READ MORE

answered Mar 26, 2019 in Power BI by Cherukuri
• 33,030 points
8,056 views
0 votes
1 answer

How to sum a data table in Power BI?

It's a good practice if you avoid ...READ MORE

answered May 17, 2019 in Power BI by Avantika
• 1,520 points

edited May 17, 2019 by Omkar 7,069 views
0 votes
1 answer

How to show visualization (map) based on latitude and longitude points in power BI?

Follow the below steps: 1. Select the map ...READ MORE

answered Oct 18, 2019 in Power BI by anonymous
• 3,450 points
2,677 views
0 votes
1 answer

How to customize colors in columns in a bar chart?

There are two ways: Go to format tab -> ...READ MORE

answered Oct 31, 2019 in Power BI by anonymous
• 33,030 points
472 views
0 votes
3 answers

How to add an extra column to the existing table in power bi query editor?

Click on edit queries after loading source ...READ MORE

answered Dec 16, 2020 in Power BI by Roshni
• 10,520 points
76,814 views
0 votes
1 answer

How to Split Columns in Power BI?

Splitting columns in Power BI using the ...READ MORE

answered Jan 6 in Power BI by anonymous
• 1,180 points
570 views
0 votes
1 answer

How to open hyperlink in the same tab in power BI

Hey, the discussion on this topic is ...READ MORE

answered Jul 10, 2019 in Power BI by anonymous
• 33,030 points
10,307 views
webinar REGISTER FOR FREE WEBINAR X
REGISTER NOW
webinar_success Thank you for registering Join Edureka Meetup community for 100+ Free Webinars each month JOIN MEETUP GROUP