How to show actual and forecast in same line chart

0 votes
How to show actual and forecast in same line chart?. I want to show sales in the same line chart for next 1 year?
May 23, 2019 in Tableau by sindhu
3,566 views

1 answer to this question.

0 votes

Hi Sindhu,

Follow the below steps:

1. Create a line chart with the required dimension/measures.

2. Create a forecast.

     View below solution to create a simple forecast.

      https://www.edureka.co/community/44161/forecast-tableau?show=44161#q44161
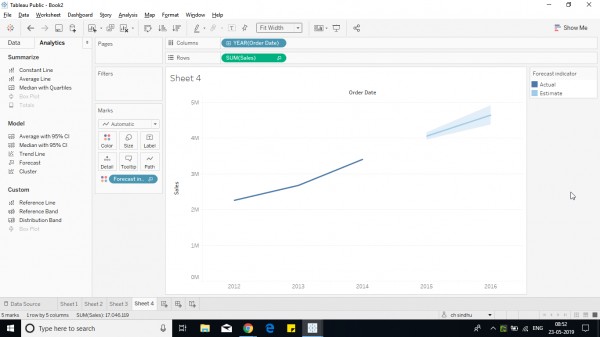
3. Not remove the forecast from the color shelf and add labels.
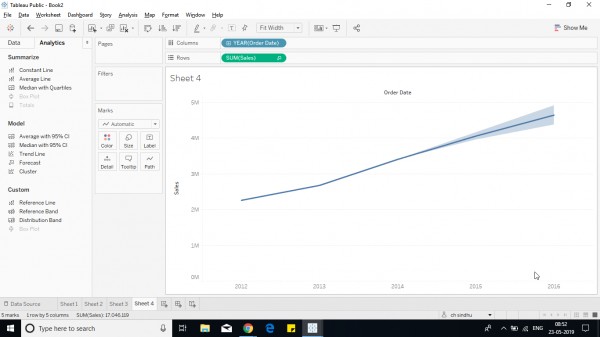
4. Edit the forecast by right-clicking on the line and Go to forecast and then click on Forecast options, Edit the number of periods and prediction interval, and unselect Show prediction levels and click ok.
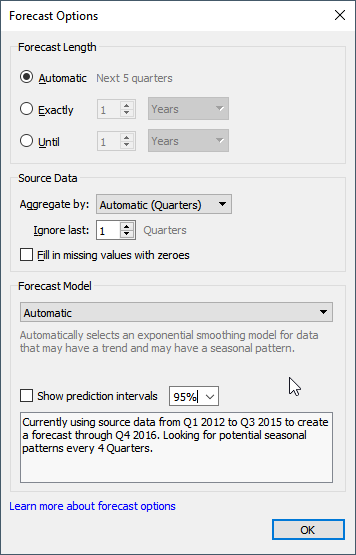
5. 
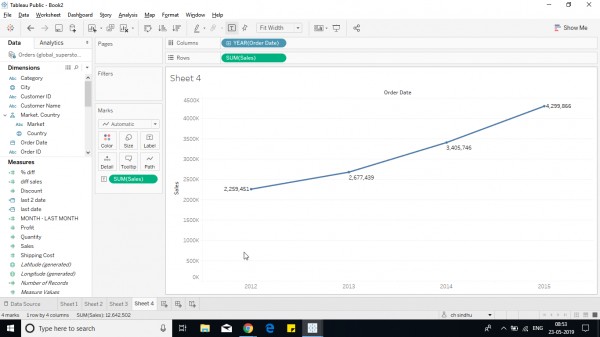
Hope it helps.

answered May 23, 2019 by Cherukuri
• 33,030 points

Related Questions In Tableau

0 votes
1 answer

How to calculate profit when cost and revenue are in same column?

You can create the following calculated fields: Profit: SUM(IIF([account_category] ...READ MORE

answered Apr 10, 2018 in Tableau by ffdfd
• 5,550 points
1,213 views
0 votes
1 answer

How to dynamically determine and categorize duplicate value in Tableau?

Apparently you define a duplicate records as ...READ MORE

answered Apr 13, 2018 in Tableau by xyz
• 1,560 points
7,263 views
0 votes
1 answer

How to combine rows with same information in Tableau

@Ghost, Tableau has a function RANK_UNIQUE which you ...READ MORE

answered May 25, 2018 in Tableau by Atul
• 10,240 points
7,684 views
0 votes
1 answer
0 votes
1 answer

How to color code cells of a column based on the text value in Tableau

You can use the following steps to ...READ MORE

answered Mar 27, 2018 in Tableau by Atul
• 10,240 points
9,937 views
+2 votes
1 answer
0 votes
1 answer

Calculated filed with if-then

Below is the required code:  IF (NOT ISNULL([test2])) ...READ MORE

answered Mar 27, 2018 in Tableau by Atul
• 10,240 points
1,620 views
+2 votes
1 answer
0 votes
1 answer

How to show percentages on the slices in pie chart in Tableau?

Hi sindhu, You can manually move the labels ...READ MORE

answered Mar 13, 2019 in Tableau by Cherukuri
• 33,030 points
11,753 views
0 votes
1 answer

How to add a story with same sheet with different parameters and filters added in tableau?

Hi Riya, Follow these steps to add sheets/dashboard ...READ MORE

answered Mar 22, 2019 in Tableau by Cherukuri
• 33,030 points
3,601 views
webinar REGISTER FOR FREE WEBINAR X
REGISTER NOW
webinar_success Thank you for registering Join Edureka Meetup community for 100+ Free Webinars each month JOIN MEETUP GROUP