Data Science with Python Certification Course
- 132k Enrolled Learners
- Weekend
- Live Class
(49300)


 Copy Link!
“Hey, how will you react, how will you feel when someone will address you as a “Scientist?”
Yes! Data Scientist!
Here your dream comes true to become a “Scientist” in the field of Analyzing Data!
And Of course! With a Great career!
Aspiring to work as a Data Scientist? Learn Data Science with R Programming! Why learn R? Because R is one of the most demanded scripting language developed by and for statisticians. With its unparalleled advantages, we introduce to you what R can do for present and future Business Analysts.
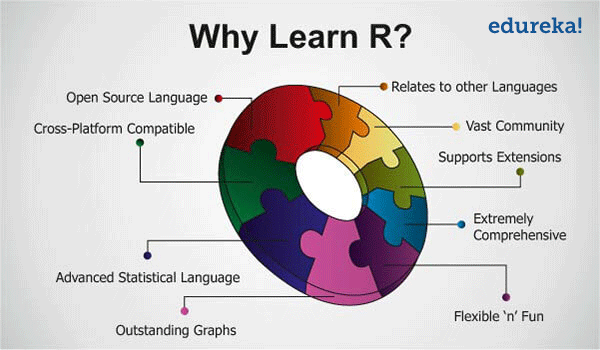
Let’s browse through the following 9 advantages of R that makes it so popular among Data Scientists:
To begin with, R is freely available! This means, anyone can download R from the internet (through a large network of mirror servers) and start working on it. What more? You can even modify the code and add your own innovations to it. R language has no licence restrictions as it is issued under the GNU (General Public License) and is an open source programming language. R can run anywhere and anytime and can also be sold adhering to the conditions of the License.
One of the biggest advantages of R is that you can run R on several operating systems and varied Software/Hardware. It is quite often used on Microsoft Windows (32-bit as well as 64-bit), Macintosh, GNU/Linux, UNIX and its derivatives such as Mac OS X, Darwin, FreeBSD, Solaris, etc. It also runs on some operating systems of Mainframes. Thanks to the efforts put in by the R Development Core Team to make it cross-platform compatible!
As R is developed by top computational statisticians and computer language designers, R programming is looked upon as a product of “International collaboration”. Undoubtedly, R is one of the most advanced statistical programming language used world-wide by several statisticians to make their lives much easier and much more productive. R programmers can work on large complex objects (not limited to a small group of problems), exchange data in MS-Excel, ensure the accuracy of the code, keep a track of every computational step, preserve the history for later reference, work on advanced statistical analysis, do intricate visualizations and so on. R is backed by very elaborate technical documentation and tutorials contributed by many users. The overall structure and syntax of R is exclusively developed for statistical computation.

R programming language has splendid Hi-Tech graphical capabilities that are incomparable with any other statistical language. That’s why programmers love R! Look at the graphs created in R, whether they are boxplots, histograms, polygons, scatterplots, barplots, arrows, trees, mathematical symbols, ggplots, all these are very impressive and self-explanatory. The graphs generated with R are high in quality and as good as publication graphs! You can create static or even dynamic graphs based on the packages you opt for! Thus, R is a fully programmable graphical language with outstanding features!
Do you think there are some bugs in existing R language that need to be addressed? You are most welcome to do that! Or do you want to invent a new analysis? Then learn R programming and get a strong hold of the Analytics world! R being fully programmable, you can even do code enhancements, develop dynamic packages, computerize repetitive procedures, develop your own apps and InfoMaps in R, create tables in LaTeX or Lyx and the list just goes on! It is easy and fun to write your own functions in R and distribute your own R software as an add-on package! The situation is such, that many new statistical methods are being developed attaching an R package to these.
Imagine a programming language offering over 4,800 packages from various repositories relating to Data mining, Bio-informatics, Econometrics, and Spatial analysis! R programming language consists of several standard statistical tests, analyses and models! R can work on objects of infinite size and intricacy with ease. The R programmers are not confined to a single method of achieving a desired graphical model or statistical computation. Instead, R performs a wide variety of functions, such as data manipulation, classical statistical tests, statistical modelling (whether linear or nonlinear), and graphical techniques, classification, clustering, and so on.

R is not only a very comprehensive language but also very extensible in its structure. Data structures in R consist of vectors, scalars, data frames, time series, matrices, lists, etc. R also supports matrix arithmetic as well as extensible object-system such as regression models and geo-spatial coordinates. R also supports procedural programming along with functions and also OOP (Object-Oriented Programming) for certain functions. R programming language also has the facility to extract data from Google using RCurl package, join the vectors or data frames of different length into a single data frame, zip fastener to join rows or columns of two data frames in a different manner and also get hold of the Normalized Google Distance (NGD) with R!
With more and more people and companies adopting R as the “Statistical Language”, R has created a vast community for itself! These like-minded people with their own experiences bring in a lot of value-addition to the discussion forums, social media, R conferences and other networking channels. Through these active groups using R, students and professionals can get a clear view what R is all about, advantages of R and how to use the striking features of R in their professional lives. Get support from the R professionals and get your queries solved within a short period of time. Become a part of the vast community of 2 million people and get started with R!
After realizing what R can do in business analysis, a new trend has become where existing software as well as emerging software are integrated with various R packages to make them more productive. Now R is getting attached to many file systems, applications and databases. Thus, R relates to other programming languages easily. R is also quite friendly while importing data not only from Microsoft Excel, but also, Microsoft Access, MySQL, SQLite, Oracle, and so on. R can also be easily connected to various databases using ODBC (Open Database Connectivity Protocol) and the ROracle package.
Are you eager to accelerate your career in the field of Business Analytics? Do you want to get into companies like SAP, Oracle, Facebook, Google , IBM, Bing, Mozilla, Thomas Cook, The University of Chicago? These and many such companies are extensively using the power of R in Business Analytics. Do you need more reasons to start learning R? No! I guess you are satisfied with the advantages of R. Come On, Get up! Start coding, retrieving, analyzing, modifying your Big data with R!
Got a question for us? Please mention them in the comments section and we will get back to you.
Related Posts:


 Thank you for registering Join Edureka Meetup community for 100+ Free Webinars each month JOIN MEETUP GROUP
Python-bison has all of this and much and much more. It is flexible and if you are looking to make presentation or publication quality graphs then you can use python-matplotlib and mayavi. It is also cross platform and you end up learning a programming language which is the language of the future.