


There are 2.72 million jobs available in the field of data science with R and Python are the two pillars that make playing with data easier. In this article on What is R programming, I’ll be concentrating on explaining the basic concepts of R.
- Features of R
- Installing R & RStudio
- R package & libraries
- Variables & Data types
- Operators
- Conditional statements
- Looping statements
- Control Statements
- Functions
- Scope of R Programming
Over the due course of the blog, you will be tasked with questions and tips to help you understand the concepts better. If you’re stuck with doubts, please post them in Edureka Community to brainstorm with other learners.
R is an open-source tool used for statistics and analytics. It has become popular in recent years with its applications in the field of Data Analytics, Data Science and Machine Learning among others.
Before we get into features and basics of R Programming, let’s see a scenario where R is used in companies.
Facebook, an online social media-based company aims at improving user engagement, creating and sharing posts. It uses R for exploratory analysis, user engagement analysis, etc. Facebook Data Science group had released a series of blogs that showed an analysis of timeline posts made by users who were Single versus those In a Relationship. The following graph shows the average number of timeline posts exchanged between two people who are about to become a couple.
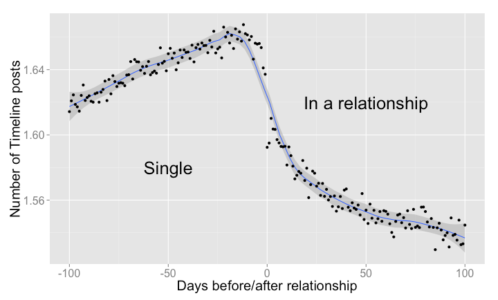

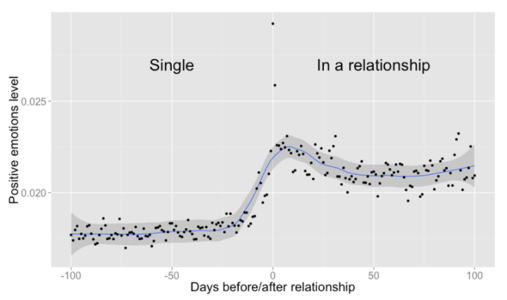
The above graph shows the steady change in the number of timeline posts 100 days before and after the relationship. The below graph shows the positive emotions increasing by using tags, words expressing positive emotions.

Now that we have an idea of what is R, let’s move onto the features of R.
Features of R
Features of R are:
- It is an open-source tool
- R supports Object-oriented as well as Procedural programming.
- It provides an environment for statistical computation and software development.
- Provides extensive packages & libraries
- R has a wonderful community for people to share and learn from experts
- Numerous data sources to connect.
Let’s move ahead to install R and RStudio.
Installing R & RStudio
Go to the R download page and click on the respective OS, click on base subfolder. You will find the downloadable link on the top of the page. Run the .exe file and complete the installation by pressing next and install. When you run the R Gui app, the R Console page will be visible at the start.
RStudio is an IDE used for R Programming which is available as open-source and commercial software for Desktop and Server products. Download RStudio Desktop from the RStudio downloads page. On the successful download of the file, run the .exe file and complete the installation. Open the RStudio App and you will see that the entire window is divided into 4 panes as below.

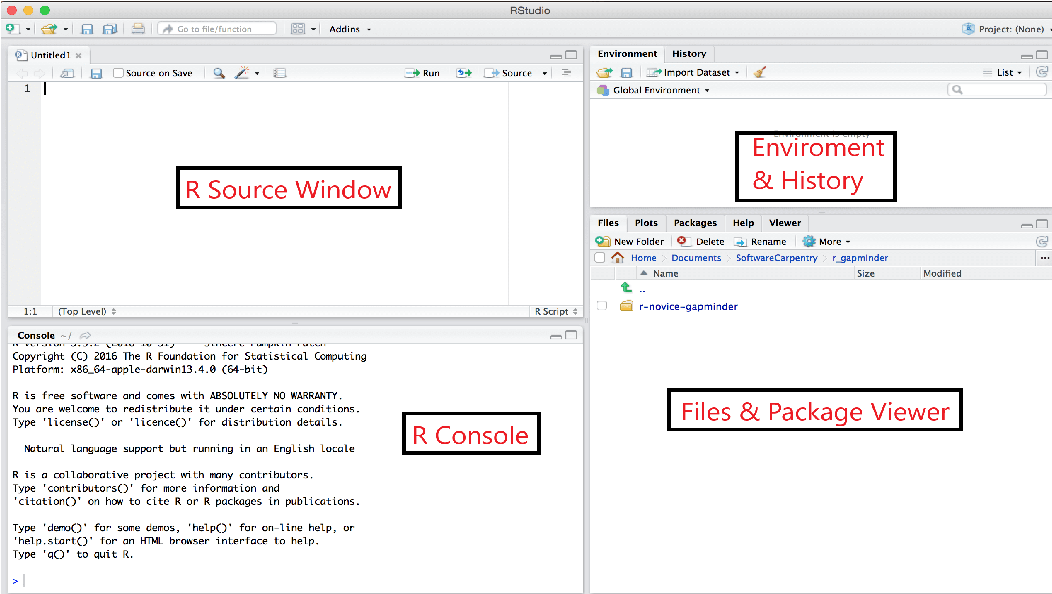
Source window
We add the source code here and run the whole code by clicking on the source button. To run selected lines, select lines and click Ctrl + Enter or Run button. Run a single line by clicking on CTRL+ Enter.
R Console
R displays error logs, warnings, executed statements with their outputs in this pane.
Environment and History
This pane consists of 3 tabs. The Environment tab displays all variables defined and used in the R session. The history tab displays the executed statements in R source and Console. The Connections tab display database and external connection-related information.
Files & Package Viewer
This pane consists of 5 tabs. The Files tab displays the files in the current working directory. The Plots tab displays graphs, charts created using R packages. The Packages tab lists down installed packages. It also contains 2 buttons (install and update). The Help tab displays the documentation of any package or function in R. The Viewer tab displays web applications and maps that are created using R.
Let’s move forward to learn what is a package and how to load the packages in RStudio.
R package & Libraries
R packages are a group of functions bundled together. These functions are pre-compiled and used in R scripts by preloading them. As discussed above, we can find the list of packages installed in the packages tab at the bottom right window. Let’s learn how to install packages in RStudio.
To install a package, use the following syntax in R Source or R Console.
install.packages([package-name])
By default, RStudio installs the packages from CRAN Repository. We can use the functions by loading the package into memory.
To load the package, use the following syntax.
library([package-name])
![]()

Variables & Data types
R Variables
Variable is the name of the memory location where data is stored. In other words, we can access memory data using variables.
In R, we can assign variables using any of the following syntaxes. The below-mentioned example assigns the value Edureka to the variable Company.
- Company = “Edureka”
- company <- “Edureka”
- “Edureka” -> CompanY
Variables can be categorized into Continuous and Categorical. If a variable can take on any value between its minimum value and its maximum value, it is called a Continuous variable. Categorical variables (sometimes called a nominal variable) are those that have a fixed number of values or choices such as “Yes”, “No”, etc.
Datatypes
R consists of 5 main data types: List, Data frame, Vector, Array and Matrix. There are 2 other types called factor and tibble, which are not primary datatypes but will be discussed below.
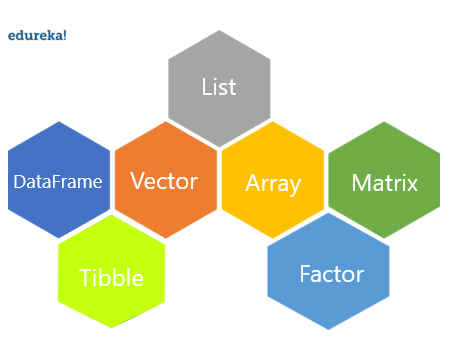

Let’s discuss all the data types in detail.
List
A list holds a list of elements. These elements could include either number, decimal number, character, or Boolean value (True/False). They are mutable, i.e., the elements in a list can be modified using the index. A list can also contain a combination of lists, vector, array, and matrix. Let’s learn various list operations –
- Creating a list
List is created using list( ) function. Use the following syntax to create a list.
list(val1,val2, . . . )Example:
mylist_1 = list(1, 3.14, "abc", "x")
mylist_1
Output:
[[1]]
[1] 1

[[2]]
[1] 3.14

[[3]]
[1] "abc"

[[4]]
[1] "x"
You can create a nested list using the same list( ) function. The only difference is that a nested list can have numbers, characters, lists, and other datatype variables.
nested_list = list(1,mylist_1,list(1,5,"a"))


Display list
Display or print list elements by calling the print( ) function or simply list name.
Example:
names = list("Rahul","Nikita","Sindhu","Ram")
names
Output:
[[1]]
[1] "Rahul"

[[2]]
[1] "Nikita"

[[3]]
[1] "Sindhu"

[[4]]
[1] "Ram"
Accessing List Elements
We access each element within a list using an index. Let’s see some examples of how to access elements.
Example:
#Create a list of names.
names = list("Rahul","Nikita","Sindhu","Ram")
#Access first element.
names[1]
Output:
[[1]]
[1] "Rahul"
Subsetting is the process of accessing several elements. The subset function is used to return subsets of a vector, matrix, or data frame which meets a particular condition. R has powerful indexing features for accessing object elements. These features can be used to select and exclude variables and observations.
Example:
#uisng :
names[2:3]
#using vector method.
names[c(2,3)]
Output:
[[1]]
[1] "Nikita"

[[2]]
[1] "Sindhu"
Update list
Existing elements in a list can be updated by using the element index. Update list elements by assigning a new value to an existing element.
Example:#Update 3rd name in names from Sindhu to Shreya. names[3] = "Shreya" names
Output:
[[1]]
[1] "Rahul"

[[2]]
[1] "Nikita"

[[3]]
[1] "Shreya"

[[4]]
[1] "Ram"
Add elements to list
As discussed before, lists are mutable, i.e. list elements can be added as well as be updated. Add a new element into a list using list function or using the length function.
Example:
names[6] = "Seetha"
names
Output:
[[1]]
[1] "Rahul"

[[2]]
[1] "Nikita"

[[3]]
[1] "Sindhu"

[[4]]
[1] "Ram"

[[5]]
NULL

[[6]]
[1] "Seetha"
Did you see something different from the previous output? That brings us to a question What is NULL?
NULL represent an element with zero length. Use length function to find the last index and add the element to the list.names[length(names)+1] = "Edureka" names
Output:
[[1]]
[1] "Rahul"

[[2]]
[1] "Nikita"

[[3]]
[1] "Bindhu"

[[4]]
[1] "Ram"

[[5]]
[1] "Edureka"

- Delete elements
List elements can be deleted by assigning the element to NULL.
Example:
#Delete list elements
names[4] = NULL
names
Output:
[[1]]
[1] "Rahul"

[[2]]
[1] "Nikita"

[[3]]
[1] "Sindhu"
Vector
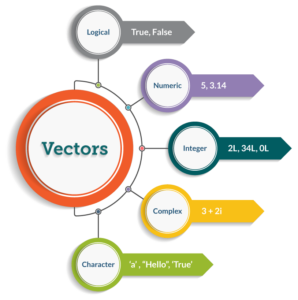

- Numeric Vector (1,808,6527,742,268)
- Integer Vector ( positive and negative real numbers )
- Character vector (“a”, “efjvfVF”, “fbyvkdsb sbv”, “ffWVWVVRV”)
- Logical vector (True/False)
- Complex vector (complex numbers of a+bi form)
Let’s learn vector operations.
Vector Operations
- Create a vector
Create a vector using c( ) function. Use the following syntax to create a vector.
c(val1, val2, ....)Roll_no = c(1,2,3,4,5) Roll_no
Output:
[1] 1 2 3 4 5
The rest operations are the same as a list which brings us to the question: What is the difference between a list and a vector?
Difference between list and a vector
- A list holds different data such as Numeric, Character, logical, etc. Vector stores elements of the same type or converts implicitly.
- Lists are recursive, whereas vector is not.
- The vector is one-dimensional, whereas the list is a multidimensional object.
Array
Array store data in more than two dimensions. It takes vectors as input and uses the values in the dim parameter to create an array.
The basic syntax for creating an array in R is −
array(data, dim, dimnames)
Where,
datainput vector which becomes the data elements of the arraydimthe dimension of the array, where you pass the number of rows, column and the number of matrices to be created by mentioned dimensionsdimnameare the names assigned to the rows and columns
Example:
v1 = c(9,1,3)
v2 = c(1,7,9,6,4,5)
#Take these vectors as input to the array.
result = array(c(v1,v2),dim = c(3,3,2))
result
Output:
, , 1
     [,1] [,2] [,3]
[1,]    9   1   6
[2,]    1   7   4
[3,]    3   9   5
, , 2
     [,1] [,2] [,3]
[1,]    9   1   6
[2,]    1   7   4
[3,]    3   9   5
Matrix
A matrix is a collection of data elements arranged in a two-dimensional rectangular layout.
The syntax to create a matrix is –
matrix(data, nrow, ncol, byrow, dimnames)
Where:
datais the input vector,nrowthe number of rows to be createdncolis the number of columns to be createdbyrowis a logical clue. If TRUE, then the input vector elements are arranged by rowdimnamenames assigned to the rows and columns
Example:
A = matrix(c(2, 6, 3, 1, 5, 7),nrow=2,ncol=3,byrow = TRUE)
A
Output:
     [,1] [,2] [,3]
[1,]   2    6    3
[2,]   1    5    7
Data Frame
A Data Frame is a table-like structure that contains rows and columns. A data frame can be created by combining vectors.
The basic syntax for creating a data frame using is –
data.frame(vect1, vect2, ...)
Example:
id = c(1:5)
names = c("Srinath","Sahil","Anitha","Peter","Siraj")
employees = data.frame(Id = id, Name = names)
employees
Output:
  Id Name
1 1 Srinath
2 2 Sahil
3 3 Anitha
4 4 Peter
5 5 Siraj
Characteristics of a data frame
- The column names should be non-empty
- Each column should contain the same amount of data items
- The data stored in a data frame can be of numeric, factor or character type
- The row names should be unique
Tibble
A Tibble is a table-like structure similar to a data frame. Create a tibble variable using the following syntax:
tibble(list1,list2, ... )
Example:
id = c(1:5)
names = c("Srinath","Sahil","Anitha","Peter","Siraj")
employees = tibble(Id = id, Name = names)
employees
Output:
# A tibble: 5 x 2
     Id Name
  <int> <chr>
1    1 Srinath
2    2 Sahil
3    3 Anitha
4    4 Peter
5    5 Siraj
Let’s find out what makes a tibble different from the data frame.
Differences between Tibble and Data Frame
- Tibble displays data along with the data type whereas a data frame display data only
- Tibble fetches data from the data source in its original data type. Dataframe fetches data from the data source as factors if data types are not specified
- Tibble is stricter than data frames in slicing. Slicing is a list/vector operation to return a slice in a given R object(vector, data frame)
Factor
A factor is another data type that is created while reading data from external data sources. While loading CSV or text files, it converts any column with categorical values to factor. Any vector can be converted to factor using below syntax:
Syntax:
as.factor(vector)
A factor converts categorical values into a numerical vector with multiple levels.
Example:
as.factor(names)
Output:
[1] Rahul Nikita Sindhu Ram
Levels: Nikita Rahul Ram Sindhu
Now we have learned different data types of R. Let’s move ahead and learn about operators in R programming.
Operators
R supports the following operators,
Arithmetic Operators
| Name | Operator | Description | Example |
| Addition | + | Perform the sum of the variables | a = 1; b = 2; c = a+b; c = 3 |
| Subtraction | – | Return difference of variables | a = 5; b = 2; c = a-b; c = 3 |
| Multiplication | * | Return product of variables | a = 3; b = 2; c = a*b; c = 6 |
| Division | / | Divide left operand by right operand | a = 1; b = 2; c = a+b; c = 3 |
| Exponent | ** | Performs exponential (power) calculation on operators | a = 3; b = 2; c = a**b; c = 9 |
- Relational Operators
| Name | Operator | Description | Example |
| Equal to | == | Return True if both operands are equal | a = 1; b = 2; a==b; FALSE |
| Not Equal to | != | Return True; If both operands are not equal | a = 5; b = 2; a!=b; TRUE |
| Greater/ Lesser than | >; < | Return True;If left operand greater right operand and vice vera. | a = 3; b = 2; a>b; TRUE |
| Greater than equal to | >= | Return True; If left operand greater than or equal to right operand | a = 3; b = 2; a>=b; TRUE |
| Less than equal to | <= | Return True; If left operand lesser than or equal to right operand | a = 3; b = 2; a<= b; FALSE |
- Logical Operators
| Name | Operator | Description | Example |
| Logical OR | | | Return TRUE, if at least one element is TRUE | a = 1; b = 2; a==b; FALSE |
| Logical AND | & | Return TRUE, if both elements are TRUE. | a = 5; b = 2; a!=b; TRUE |
| Logical NOT | ! | Return opposite or negation of element | a = 3; b = 2; a>b; TRUE |
Assignment Operators
Assignment operator assigns value or variable to operand.
The assignment operators are =, <-, ->.
Examples:
10 -> b
a = 5
c <- a+b
We have covered different operators used in R Programming, now let’s understand various Conditional, Looping and Control statements.
Conditional statements
R comprises 3 conditional statements which are –
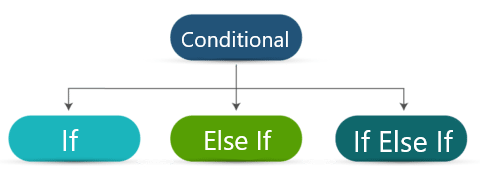

Lets us discuss them individually.
If Statement
The flow of If statement:
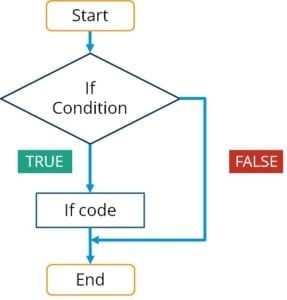

As shown in the above picture, if the condition is true, then execute If code else executes the statements that come after if body.
Syntax:
if(condition) {
 If code
 }
 statements
Example:
Grade = "Good"
if(Grade == "Good") {
print("Good")
}
Output:
[1] "Good"
Else If Statement
The flow of Else If Statement:
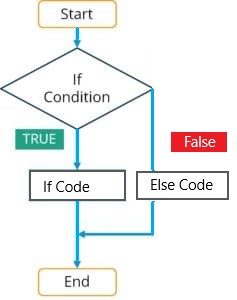

As shown in the above picture, if the condition is true, then execute If code else executes Else code and then follow the statements that come after the if-else body.
Syntax:
if(condition) {If code}else {Else code}Statements
Example:
Grade = "Good"
if(Grade == "Good") {
print("Good")
}
else {
print("Bad")
}
Output:
[1] "Good"
If Else If Statement
The flow of If Else If Statement:
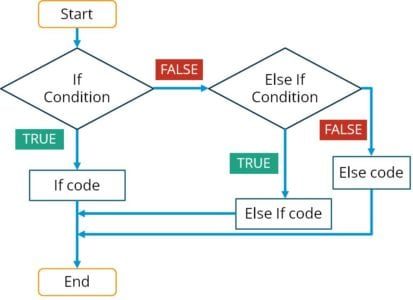

As shown in the above picture, if the condition is true, then execute If code else checks the second condition. If the condition is true, execute Else If code otherwise executes Else code followed by statements that come after if-else-if body.
Syntax:
f(condition) {If code}else if (condition){Else if code}else {Else code}
Example:
Grade = "OK"
if(Grade == "Good") {
print("Good")
}
else if(Grade == "OK") {
print("Ok")
}
else {
print("Bad")
}
Output:
[1] "Ok"
Switch statement
A switch is another conditional statement used in R. If statements are generally preferred over switch statements. The basic syntax of the switch statement is –
Syntax:
switch (expression, list)
switch(2,"GM","GA","GN")
Output:
[1] "GA"
Looping statements
Looping statements reduce the work of a user to perform a task multiple times. These statements execute a segment of code repeatedly until the condition is met.
R comprises 3 looping statements which are,
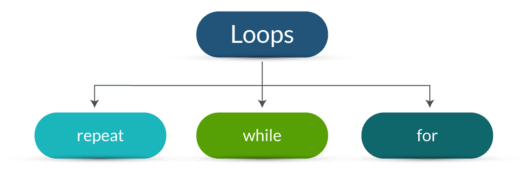

Lets us discuss each in detail.
For Loop
For loop is the most common looping statement used for repeating a task. A for loop executes statements for a known number of times. Define a for loop using the following syntax:
Syntax:
for(var in range){statements}
Example:
for(x in 1:10){
print(x)
}
Output:
[1] 1
[1] 2
[1] 3
[1] 4
[1] 5
[1] 6
[1] 7
[1] 8
[1] 9
[1] 10
While Loop
A while loop repeats a statement or group of statements until the condition is true. It tests the condition before executing the loop body. A while loop is created using the following syntax:
Syntax:
while(condition) {Statement}
Example:
a = 5
while(a>0) {
a=a-1
print(a)
}
Output:
[1] 4
[1] 3
[1] 2
[1] 1
[1] 0
Repeat
Repeat loop is the best example of an exit controlled loop where the code is first executed and then the condition is checked to determine if the control should be inside the loop or exit from it. Create a repeat loop using the following syntax:
Syntax:
repeat {statementsif(condition) {statements}}
Example:
m=5
repeat {
m= m+2
print(m)
if(m>15) {
break
}
}
Output:
[1] 7
[1] 9
[1] 11
[1] 13
[1] 15
[1] 17
Control statements
R has the following control statements,

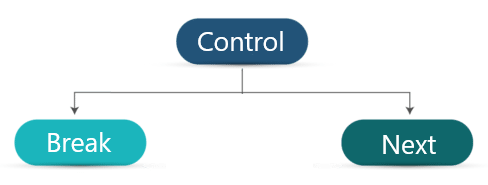
Lets us discuss each in detail.
Break
A break statement is used to stop or terminate the execution of statements. When the break statement is encountered inside a loop, the loop is immediately terminated and program control resumes at the next statement following the loop. If else and switch statements contain break statements usually to stop the execution. The syntax to use the break statement is –
Syntax:
break
Example:
m=5
repeat {
m= m+2
print(m)
if(m>15) {
break
}
}
Output:
[1] 7
[1] 9
[1] 11
[1] 13
[1] 15
[1] 17
Next
The next statement is used to skip the current iteration of a loop without terminating or ending it. The syntax of the next statement is –
Syntax:
next
Example:
for(i in c(1:6)) {
  if (i == "3") {
next
  }
  print(i)
}
Output:
[1] 1
[1] 2
[1] 4
[1] 5
[1] 6
Functions
A function is a set of statements to perform a specific task. R has in-built functions and also allows the user to create their own functions. A function performs a task and returns a result into a variable or print the output in the console.
R contains two types of functions,
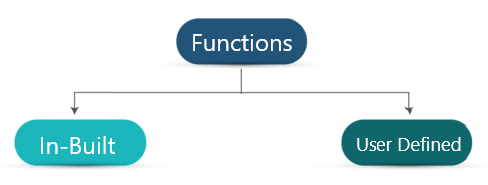
Built-in Functions
Built-in functions are those pre-defined in R such as mean, sum, median, etc.
User-Defined Functions
User-Defined functions are defined as per the requirements. Define a function using the following syntax:
Function definition
function_name <- function(arg_1, arg_2, ...) {Function body}
Store the function definition in a variable and call the function using variable followed by optional parameters inside the parenthesis ( ).
Example
factorial <- function(n) {
if(n<= 1) { return(1)
}
else {
return(n * factorial(n-1))
}
}
factorial(3)[1] 6
Scope of R programming
In this busy world, everybody learns a new language or technology for the sake of career, fame or salary. Before learning or taking up any course, this question would come to anyone’s mind “What is R Programming and why to learn R over other technologies and tools?”.
R has an excellent growth in various aspects such as Career growth, Job aspect, Business requirements, Cost, Salary, etc. It is open source and has been gaining a lot of audiences lately. It reduces half the burden to buy a licensed product. R is an All in one tool that not only performs analysis but is also used in making reports, dashboards, applications, etc. let’s discuss a few aspects of “why to learn R?’.
Salary
The need for people with R skills is increasing and so is the salary. Salary of engineers or programmers working with R varies between 3.9LPA to 20LPA. As shown in the image below.
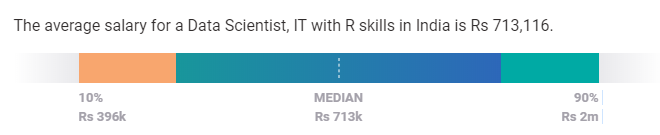

Source: Payscale.
Job roles
The number of jobs available for R Programmers is increasing in recent years. There are different roles available for people with R Programming skills such as –
- Data Scientist
- Data Analyst
- R Programmer/ Developer
- Business Analyst
- Data Science Engineer
- ML Engineer
Career growth & Job opportunities
According to the various forums, data analysts will be in high demand in companies around the world. R is the most used analytics tool across the world which is estimated to have a wide range of users. Various companies such as Infosys, Wipro, Accenture, etc have grown in this domain to hire talented people as well as provide training to their employees.
I hope readers found this article “What is R Programming” helpful. Ask any queries related to this article or R Programming in the comments section or here. We will get back to you ASAP.
If you wish to learn R Programming and build a colorful career in Data Analytics, then check out our Data Analytics using R which comes with instructor-led live training and real-life project experience. This training will help you understand data analytics and help you achieve mastery over the subject.