
Tableau Certification Training Course
- 61k Enrolled Learners
- Weekend/Weekday
- Live Class
(23050)


 Copy Link!
Power BI is the modern compass that helps businesses navigate through the chaos in a world where data is being processed more quickly than decisions. Imagine turning endless spreadsheets into eye-catching graphics, identifying business trends rapidly, and making decisions based on facts rather than intuition. That’s Power BI’s magic.
This guide is your free pass to comprehending and becoming an expert in Power BI, regardless of whether you’re a manager chasing KPIs, a business analyst hoping to transform dashboards into storytelling tools, or a data-curious novice wondering how to dive into BI without drowning.
All set to move on from “What is Power BI?” Let’s boost our power.
There are a couple of reasons why Power BI is such a powerful BI tool.
Alright, now that you know the importance of Power BI in the Analytics field, let’s understand what Power BI is?
Interested? So, before I tell you, let’s see what is its importance & why organizations are hunting for professionals with Power BI Course.
Microsoft’s Power BI is a cloud-based, business analytics service for analyzing and visualizing data.
Microsoft Power BI gives you a platform to be productive and creative with reports and analytics. Churning out useful information from the data and creating visual-reports is a multi-step process, let me brief you about the steps. Before that you can check below video.
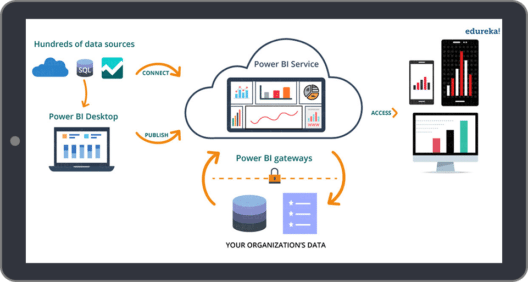
Go from data to insight to option in a series of steps.
Power BI lets you connect to an extensive variety of data sources. And, you can either use Power BI Desktop or Power BI Services to connect to your data. Your options are to import it into Power BI or to upload your file.
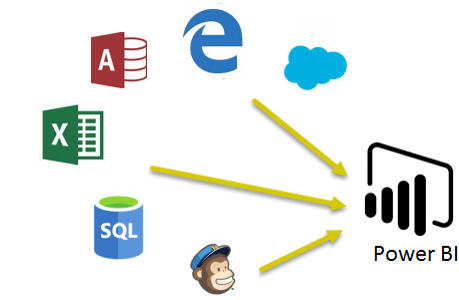
Fig1. Connecting data from various sources to Power BI
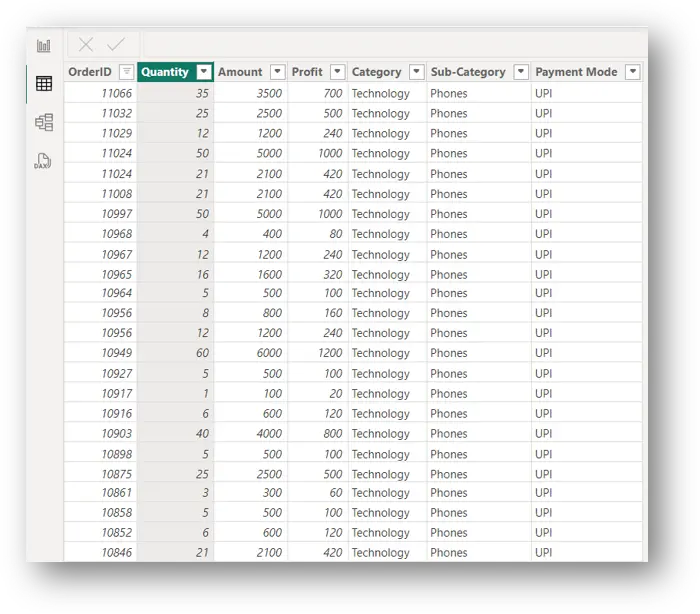
Once your data has been loaded, you can shape the data according to your needs. This shaping or transforming the data includes renaming columns or tables, changing the text to numbers, removing rows, setting the first row as headers, and so on.

This step is basically to enhance the data with relationships, calculations, measures, hierarchies etc that can be used to find business insights. Also, you can write a query to enhance data for better visualizations and analytics.

Fig 3. Modelling of data
This is probably the step where you play around with data and visualization types. With a variety of visual tools and custom visual gallery, you can create stunning reports for your organization effectively. So, a business user simply could mash up the data without writing even a single line of code. Exactly, It’s that easy!!
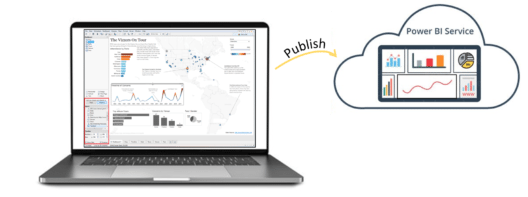
Now, Suppose you want to share these analytics reports with your organization.
Well, using Power BI Services, you can export or publish reports securely and set up automatic data refresh which provides near-real-time analytics of trends and indicators for everyone.
With real-time Power BI dashboards, you can get a 360-degree view of your business and you can instantly check when your business needs your attention.
Power BI gateways let you connect with SQL Server Databases, Analytical Services, and many other data sources to your dashboard and reporting portals. These gateways also enable you to embed Power BI reports and dashboards to give you a unified experience.
This is how a dashboard looks like:
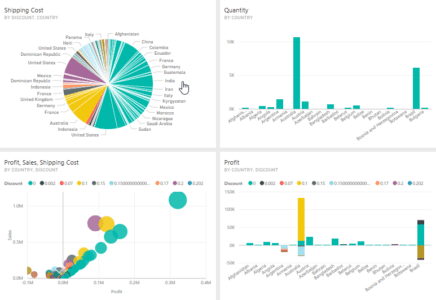
In awe yet? Let me add more to your fascination because the Power BI tool gives you more.
To deliver your solution even faster you can integrate your application or service with Power BI using standard-based REST API.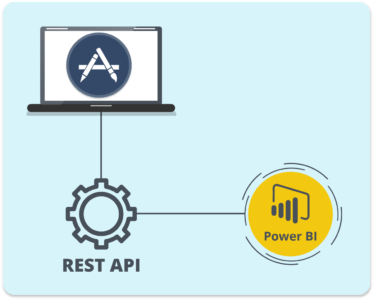
No matter where you are, using Power BI Mobile apps for Windows or iOS you can access all your business data.


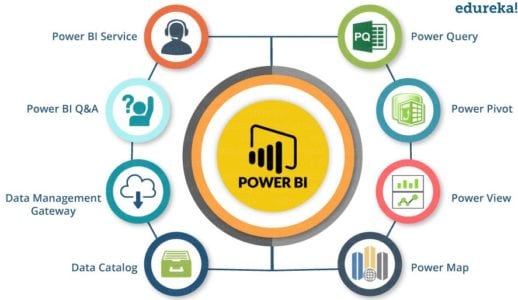
Power BI comprises multiple tools and services, each designed for specific purposes:
What is Power BI used for?
Business intelligence, reporting, and data visualization are the main uses for Power BI. It benefits organizations:
Who uses Power BI?
People in many different jobs and fields use Power BI:
Because it can be used in so many different ways, it is popular in fields like finance, healthcare, retail, manufacturing, and technology.
What are the advantages of Power BI?
Easy to use: Report building is made possible by a drag-and-drop interface.
Broad connectivity: Accommodates hundreds of data sources, such as flat files, databases, and cloud services.
Real-time data: Live data can be automatically added to dashboards.
Integration: Works in unison with Microsoft products like Teams, Excel, and Azure.
Economical: provides reasonably priced Pro and Premium tiers in addition to a free desktop version.
AI features: Integrated AI for forecasting, natural language queries, and anomaly detection.
Cooperation: Simple internal sharing and cooperation.
Disadvantages of Power BI
Learning curve: It takes time and practice to use advanced features like data modeling and DAX formulas.
Limits on data size: If very large datasets are not optimized, performance may suffer.
Limited visual customization: Power BI offers fewer options for visual customization than rivals like Tableau.
Internet dependence: Cloud features have limited offline capabilities and require Internet access.
Complex licensing: New users may find pricing tiers confusing.
What are the key features of Power BI?
Interactive Dashboards: Produce drillable, dynamic reports for comprehensive data analysis.
Broad Data Connectivity: Provides access to a variety of data sources, such as files, databases, and cloud services.
Power Query: Simple, coding-free data transformation and cleaning.
Develop connections and apply formulas for advanced analytics with data modeling and DAX.
Custom Visuals: Go beyond standard visuals to access and create original charts.
AI insights: Make use of AI technologies such as anomaly detection and natural language queries.
Real-time analytics: Keep an eye on real-time data streams to make prompt decisions.
Mobile Access: Use mobile devices to view reports at any time.
Create comprehensive, print-ready reports with pagination.
Microsoft Integration: Integrates easily with Teams, Excel, Azure, and other programs.
Security: Puts data governance and row-level security into practice.
Data Refresh & Dataflows: Automate ETL procedures and data updates.
Embedded Analytics: Incorporate data into unique websites and applications.
Connect to data: Import or connect live to data from various sources.
 Transform data: Use Power Query to clean, filter, and shape your data.
Build data models: Define relationships between tables and create calculated columns/measures with DAX.
Create visualizations: Use charts, maps, and tables to represent data meaningfully.
Publish reports: Upload reports to Power BI Service.
Share dashboards: Distribute interactive reports with team members or stakeholders.
Set up refresh schedules: Ensure data stays current with automated refreshes.
How does Power BI match your Role?
Data analysts: Create intricate models and unique reports using them for in-depth analysis.
Business Users: Use dashboards and explore them without knowing how to write code.
Developers: Create specialized graphics or integrate Power BI reports into unique apps.
Executives: Use real-time KPIs to track the health of your company.
IT specialists: oversee compliance, data gateways, and security.
Learning how to confidently and quickly transform raw data into insightful, actionable insights is essential to becoming a Power BI crackerjack. It involves more than just creating reports; it consists of creating interactive dashboards, refining data models, and using sophisticated DAX formulas to address intricate business queries.
To do this, concentrate on developing a strong foundation in Power BI Desktop for creating reports, master Power Query for transforming data, and recognize the significance of data modeling and relationships. Create custom calculations and KPIs by delving into DAX (Data Analysis Expressions). Remember to look into Power BI Service so you can work with your team and securely share reports.
Get skilled in the following components of Power BI:
So, now that you know what are skills you need to master, let’s move further and see what are the leading companies where Power BI is being used.
Because of its strong business intelligence and data visualization features, Power BI is extensively used across industries. Prominent multinational corporations rely on Power BI to convert their data into insights that can be used to improve decision-making.
Several well-known businesses that use Power BI are:
Google, Nestlé, Walmart, Adobe, and Microsoft
Power BI’s adaptability and simplicity of integration with other Microsoft tools make it a top option for companies looking to leverage data-driven insights, whether they are in the healthcare, retail, manufacturing, or financial sectors. Its robust user base and frequent updates guarantee that businesses remain on top of the data analytics game.
There is a long list of companies using Power BI for analytics, these are just to name a few:
Now the question arises why Power BI is so popular in the market?
To answer that I have compared three cutting-edge self-service BI tools aimed at giving you direct access to all the insights your data can provide.
| Metrics | Microsoft Power BI | Tableau Desktop | QlikView |
| Free Version Available | ✔ | ✖ | ✔ |
| Mobile Versions | ✔ | ✔ | ✔ |
| Point-in-time Analytics | ✔ | ✔ | ✔ |
| Real-Time Analytics | ✔ | ✔ | ✔ |
| Predictive Analytics | ✔ | ✔ | ✖ |
| Data Prep Tools | ✔ | ✔ | ✔ |
| Tools to Blend/ Join/ Integrate Data | ✔ | ✔ | ✔ |
| Semantic Querying/ Natural Language | ✔ | ✖ | ✖ |
| Social Media Analytics | ✔ | ✔ | ✔ |
| Visualizations Feature | ✔ | ✔ | ✔ |
| Sharing/ Collaboration Tool | ✔ | ✔ | ✔ |
I think now it’s clear why Power BI stands out from other BI tools.
Comparing Leading Analytics Tools
Power BI: Excellent integration, affordable, and ideal for Microsoft users.
Tableau: More expensive but renowned for its sophisticated visualizations and adaptability.
QlikView: More difficult to learn, but strong data exploration with associative models.
Every tool has advantages, and the best option will rely on the needs of the company, the available funds, and the infrastructure.
How does Microsoft Fabric work with Power BI?
From data ingestion and storage to governance and analytics, Microsoft Fabric is a unified data platform that streamlines the data lifecycle. A seamless end-to-end data experience is created within the Microsoft ecosystem by Power BI’s seamless integration with Fabric, which allows users to access clean, governed data from OneLake, develop analytics, and exchange insights.
Power BI Service’s Paginated Reports
For pixel-perfect, printable reporting requirements such as operational reports, forms, and invoices, paginated reports are made. Paginated reports are perfect for detailed and formatted document outputs because they can handle large amounts of data and provide precise formatting, unlike standard Power BI reports.
Power BI Report Server on-premises reporting.
In order to comply with stringent data privacy or compliance regulations, the Power BI Report Server enables enterprises to host reports locally rather than in the cloud. It allows businesses to use contemporary BI capabilities while maintaining sensitive data on-premises by supporting both Power BI reports and conventional paginated reports.
Conclusion
Power BI is a powerful and adaptable business intelligence tool that enables users in a variety of positions and sectors to transform complicated data into insights that can be put to use. Modern data-driven organizations favor it because of its scalable architecture, rich ecosystem, and integration with Microsoft products.
FAQ
What distinguishes Excel from Power BI?
Power BI is a specialized analytics platform made for interactive, real-time BI with big datasets, while Excel is a spreadsheet program with some data visualization capabilities.
What is Beginner’s Power BI?
With drag-and-drop report creation, straightforward data connections, and guided tutorials, Power BI provides a simple starting point for novices.
What is BI Power in its Complete Form?
Power BI, where BI stands for business intelligence, is the proper term.
This blog highlights Power BI’s key features, uses, and integration with Microsoft Fabric, showing how it simplifies data analysis and visualization across roles and industries. It also discusses its advantages, drawbacks, and the reasons it’s a great option for business intelligence.
So wait not, download Power BI Desktop and see how Power BI makes it easy to combine your data, find new insights, and share them with others. Master the art of data visualization and analysis with our comprehensive Power BI Tutorial series.
Also, If you wish to build a career in business intelligence, our Business Intelligence Course will help you mine that data and enhance the decision-making processes throughout your organization.
Got a question for us? Please mention it in the comments section of and I will get back to you.
Also Read:
Microsoft Power BI exam (PL 300) voucher – retake included ?


 Thank you for registering Join Edureka Meetup community for 100+ Free Webinars each month JOIN MEETUP GROUP