


As the world entered the era of big data, the need for its storage also grew. It was the main challenge and concern for the enterprise industries until 2010. The main focus was on building a framework and solutions to store data. Now when Hadoop and other frameworks have successfully solved the problem of storage, the focus has shifted to the processing of this data. Data Science is the secret sauce here. All the ideas which you see in Hollywood sci-fi movies can actually turn into reality by Data Science. Data Science is the future of Artificial Intelligence. Therefore, it is very important to understand what is Data Science and how can it add value to your business.
By the end of this blog, you will be able to understand what is Data Science and its role in extracting meaningful insights from the complex and large sets of data all around us. To get in-depth knowledge of Data Science, you can enroll for live Data Science with Python Course by Edureka with 24/7 support and lifetime access.
What is Data Science?
Data Science is a blend of various tools, algorithms, and machine learning principles with the goal of discovering hidden patterns from the raw data. But how is this different from what statisticians have been doing for years?
The answer lies in the difference between explaining and predicting.
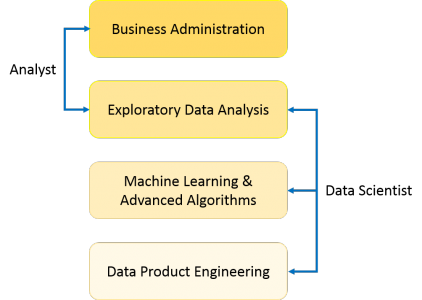

As you can see from the above image, a Data Analyst usually explains what is going on by processing history of the data. On the other hand, Data Scientist not only does the exploratory analysis to discover insights from it, but also uses various advanced machine learning algorithms to identify the occurrence of a particular event in the future. A Data Scientist will look at the data from many angles, sometimes angles not known earlier.
So, Data Science is primarily used to make decisions and predictions making use of predictive causal analytics, prescriptive analytics (predictive plus decision science) and machine learning.
- Predictive causal analytics – If you want a model that can predict the possibilities of a particular event in the future, you need to apply predictive causal analytics. Say, if you are providing money on credit, then the probability of customers making future credit payments on time is a matter of concern for you. Here, you can build a model that can perform predictive analytics on the payment history of the customer to predict if the future payments will be on time or not.
- Prescriptive analytics: If you want a model that has the intelligence of taking its own decisions and the ability to modify it with dynamic parameters, you certainly need prescriptive analytics for it. This relatively new field is all about providing advice. In other terms, it not only predicts but suggests a range of prescribed actions and associated outcomes.
The best example for this is Google’s self-driving car which I had discussed earlier too. The data gathered by vehicles can be used to train self-driving cars. You can run algorithms on this data to bring intelligence to it. This will enable your car to take decisions like when to turn, which path to take, when to slow down or speed up.
- Machine learning for making predictions — If you have transactional data of a finance company and need to build a model to determine the future trend, then machine learning algorithms are the best bet. This falls under the paradigm of supervised learning. It is called supervised because you already have the data based on which you can train your machines. For example, a fraud detection model can be trained using a historical record of fraudulent purchases.
- Machine learning for pattern discovery — If you don’t have the parameters based on which you can make predictions, then you need to find out the hidden patterns within the dataset to be able to make meaningful predictions. This is nothing but the unsupervised model as you don’t have any predefined labels for grouping. The most common algorithm used for pattern discovery is Clustering.
Let’s say you are working in a telephone company and you need to establish a network by putting towers in a region. Then, you can use the clustering technique to find those tower locations which will ensure that all the users receive optimum signal strength.
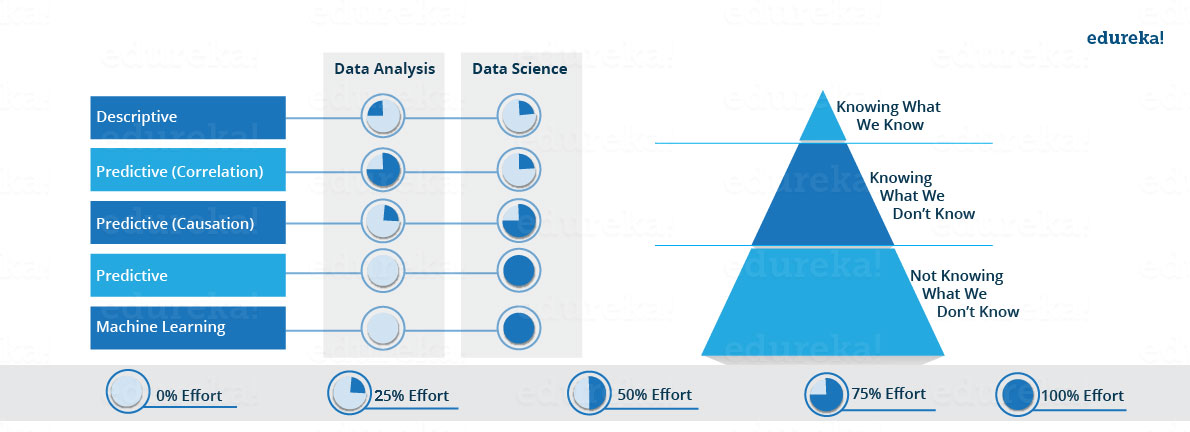
Let’s see how the proportion of above-described approaches differ for Data Analysis as well as Data Science. As you can see in the image below, Data Analysis includes descriptive analytics and prediction to a certain extent. On the other hand, Data Science is more about Predictive Causal Analytics and Machine Learning.

Now that you know what exactly is Data Science, let now find out the reason why it was needed in the first place.
Why Data Science?
- Traditionally, the data that we had was mostly structured and small in size, which could be analyzed by using simple BI tools. Unlike data in the traditional systems which were mostly structured, today most of the data is unstructured or semi-structured. Let’s have a look at the data trends in the image given below which shows that by 2020, more than 80 % of the data will be unstructured.
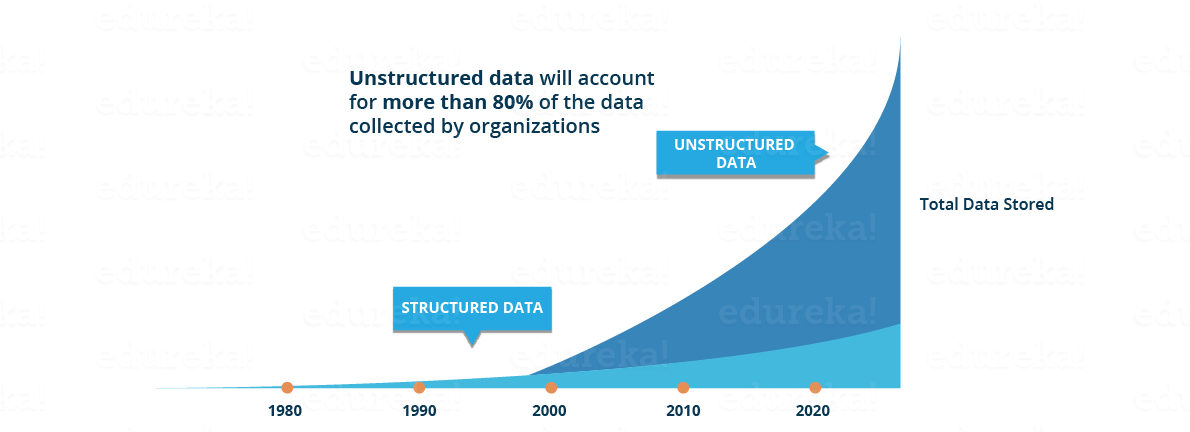
This data is generated from different sources like financial logs, text files, multimedia forms, sensors, and instruments. Simple BI tools are not capable of processing this huge volume and variety of data. This is why we need more complex and advanced analytical tools and algorithms for processing, analyzing and drawing meaningful insights out of it.
This is not the only reason why Data Science has become so popular. Let’s dig deeper and see how Data Science is being used in various domains.
- How about if you could understand the precise requirements of your customers from the existing data like the customer’s past browsing history, purchase history, age and income. No doubt you had all this data earlier too, but now with the vast amount and variety of data, you can train models more effectively and recommend the product to your customers with more precision. Wouldn’t it be amazing as it will bring more business to your organization?
- Let’s take a different scenario to understand the role of Data Science in decision making. How about if your car had the intelligence to drive you home? Self-driving cars collect live data from sensors, including radars, cameras, and lasers to create a map of its surroundings. Based on this data, it takes decisions like when to speed up, when to speed down, when to overtake, where to take a turn – making use of advanced machine learning algorithms.
- Let’s see how Data Science can be used in predictive analytics. Let’s take weather forecasting as an example. Data from ships, aircraft, radars, satellites can be collected and analyzed to build models. These models will not only forecast the weather but also help in predicting the occurrence of any natural calamities. It will help you to take appropriate measures beforehand and save many precious lives.
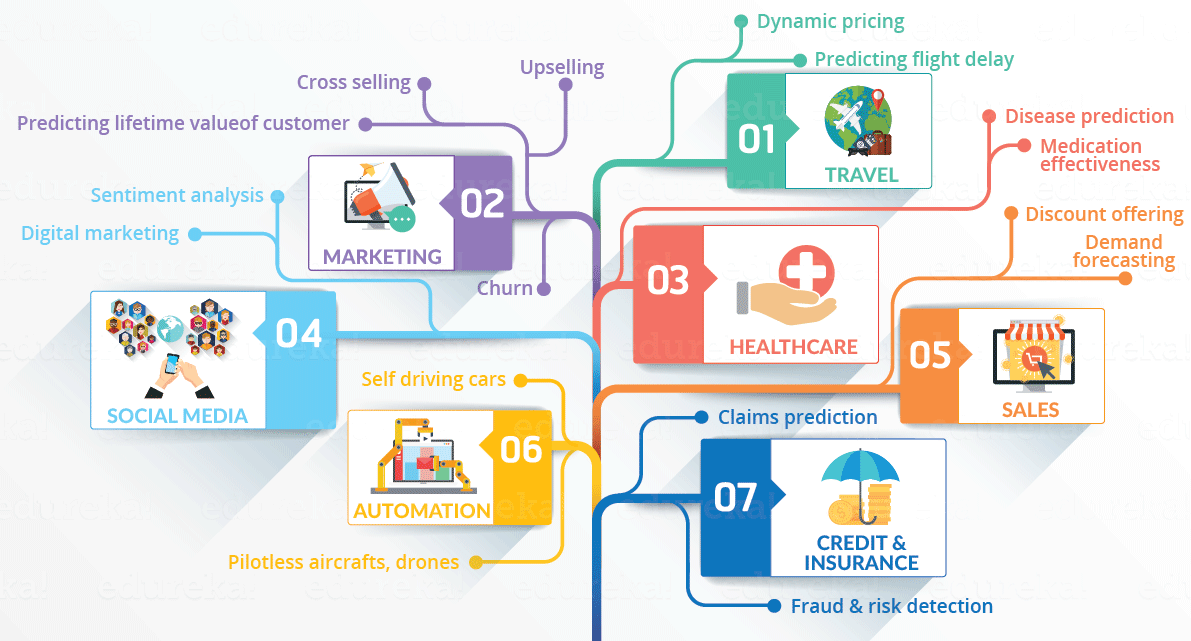
Let’s have a look at the below infographic to see all the domains where Data Science is creating its impression.

Who is a Data Scientist?
There are several definitions available on Data Scientists. In simple words, a Data Scientist is one who practices the art of Data Science. The term “Data Scientist” has been coined after considering the fact that a Data Scientist draws a lot of information from the scientific fields and applications whether it is statistics or mathematics.

What does a Data Scientist do?
Data scientists are those who crack complex data problems with their strong expertise in certain scientific disciplines. They work with several elements related to mathematics, statistics, computer science, etc (though they may not be experts in all these fields). They use the latest technologies to find solutions and reach conclusions that are crucial for an organization’s growth and development. Data Scientists present the data in a much more useful form than the raw data available to them from structured and unstructured forms.
To know more about a Data Scientist you can refer to this article on Who is a Data Scientist?
Moving further, lets now discuss BI. I am sure you might have heard of Business Intelligence (BI) too. Often Data Science is confused with BI. I will state some concise and clear contrasts between the two, which will help you better understand. Let’s have a look.
Business Intelligence (BI) vs. Data Science
- Business Intelligence (BI) basically analyzes the previous data to find hindsight and insight to describe business trends. Here BI enables you to take data from external and internal sources, prepare it, run queries on it and create dashboards to answer questions like quarterly revenue analysis or business problems. BI can evaluate the impact of certain events in the near future.
- Data Science is a more forward-looking approach, an exploratory way with the focus on analyzing the past or current data and predicting the future outcomes with the aim of making informed decisions. It answers the open-ended questions as to “what” and “how” events occur.
Let’s have a look at some contrasting features.
| Features | Business Intelligence (BI) | Data Science |
| Data Sources | Structured (Usually SQL, often Data Warehouse) | Both Structured and Unstructured ( logs, cloud data, SQL, NoSQL, text) |
| Approach | Statistics and Visualization | Statistics, Machine Learning, Graph Analysis, Neuro- linguistic Programming (NLP) |
| Focus | Past and Present | Present and Future |
| Tools | Pentaho, Microsoft BI, QlikView, R | RapidMiner, BigML, Weka, R |
This was all about what is Data Science, now let’s understand the lifecycle of Data Science.
A common mistake made in Data Science projects is rushing into data collection and analysis without understanding the requirements or even framing the business problem properly. Therefore, it is very important for you to follow all the phases throughout the Data Science lifecycle to ensure the project’s smooth functioning.
Explore the promising future scope of data science careers in our comprehensive guide – unlock opportunities and chart your path to success
Lifecycle of Data Science
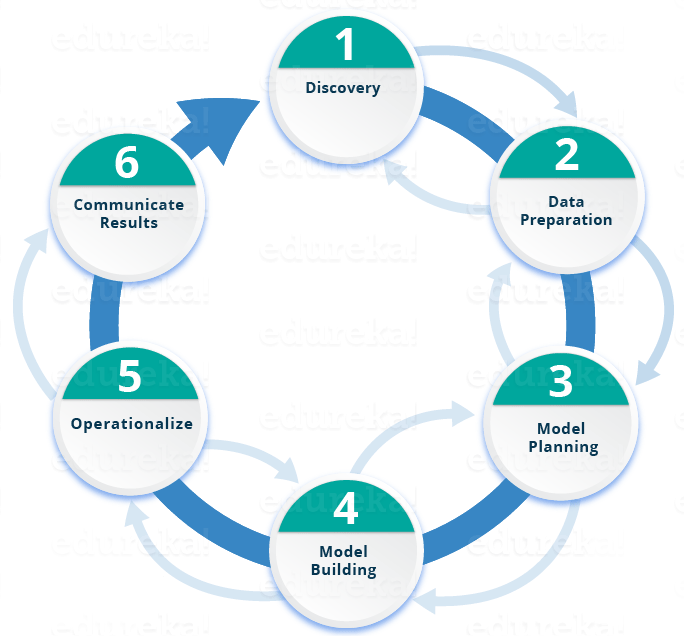
Here is a brief overview of the main phases of the Data Science Lifecycle:


Phase 2—Data preparation: In this phase, you require analytical sandbox in which you can perform analytics for the entire duration of the project. You need to explore, preprocess and condition data prior to modeling. Further, you will perform ETLT (extract, transform, load and transform) to get data into the sandbox. Let’s have a look at the Statistical Analysis flow below.

You can use R for data cleaning, transformation, and visualization. This will help you to spot the outliers and establish a relationship between the variables. Once you have cleaned and prepared the data, it’s time to do exploratory analytics on it. Let’s see how you can achieve that.

Phase 3—Model planning: 

Let’s have a look at various model planning tools.
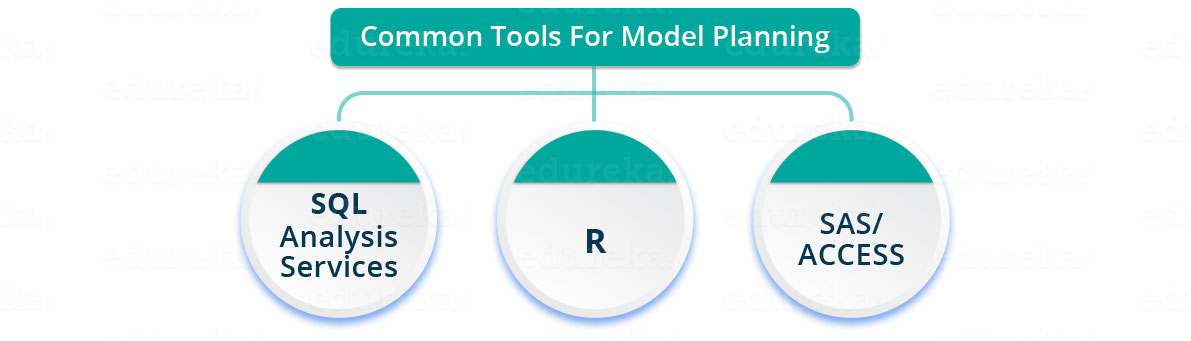

- R has a complete set of modeling capabilities and provides a good environment for building interpretive models.
- SQL Analysis services can perform in-database analytics using common data mining functions and basic predictive models.
- SAS/ACCESS can be used to access Hadoop data and to create repeatable and reusable model flow diagrams.
Although, many tools are present in the market but R is the most commonly used tool.
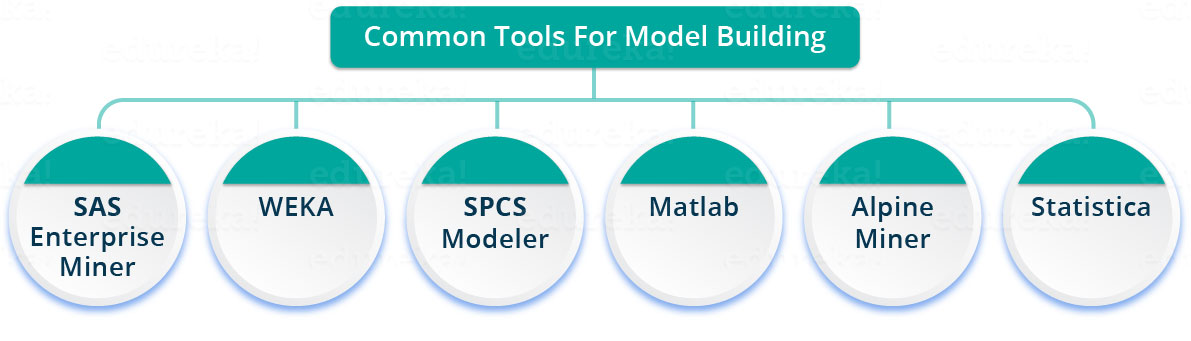
Now that you have got insights into the nature of your data and have decided the algorithms to be used. In the next stage, you will apply the algorithm and build up a model.


You can achieve model building through the following tools.
Phase 5—Operationalize: 


Now, I will take a case study to explain you the various phases described above.
Case Study: Diabetes Prevention
What if we could predict the occurrence of diabetes and take appropriate measures beforehand to prevent it?
In this use case, we will predict the occurrence of diabetes using the entire lifecycle we discussed earlier. Let’s go through the various steps.
Step 1:
- First, we will collect the data based on the medical history of the patient as discussed in Phase 1. You can refer to the sample data below.
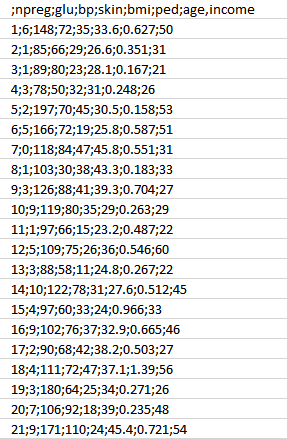

- As you can see, we have the various attributes as mentioned below.
Attributes:
- npreg – Number of times pregnant
- glucose – Plasma glucose concentration
- bp – Blood pressure
- skin – Triceps skinfold thickness
- bmi – Body mass index
- ped – Diabetes pedigree function
- age – Age
- income – Income
Step 2:
- Now, once we have the data, we need to clean and prepare the data for data analysis.
- This data has a lot of inconsistencies like missing values, blank columns, abrupt values and incorrect data format which need to be cleaned.
- Here, we have organized the data into a single table under different attributes – making it look more structured.
- Let’s have a look at the sample data below.
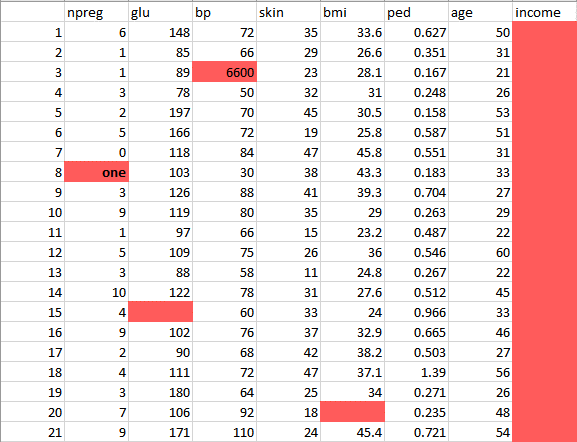

This data has a lot of inconsistencies.
- In the column npreg, “one” is written in words, whereas it should be in the numeric form like 1.
- In column bp one of the values is 6600 which is impossible (at least for humans) as bp cannot go up to such huge value.
- As you can see the Income column is blank and also makes no sense in predicting diabetes. Therefore, it is redundant to have it here and should be removed from the table.
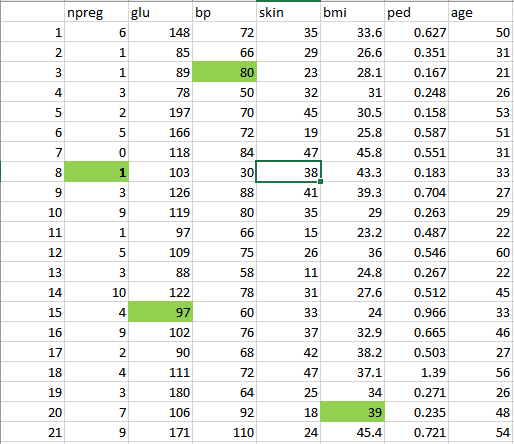
- So, we will clean and preprocess this data by removing the outliers, filling up the null values and normalizing the data type. If you remember, this is our second phase which is data preprocessing.
- Finally, we get the clean data as shown below which can be used for analysis.

Step 3:
Now let’s do some analysis as discussed earlier in Phase 3.
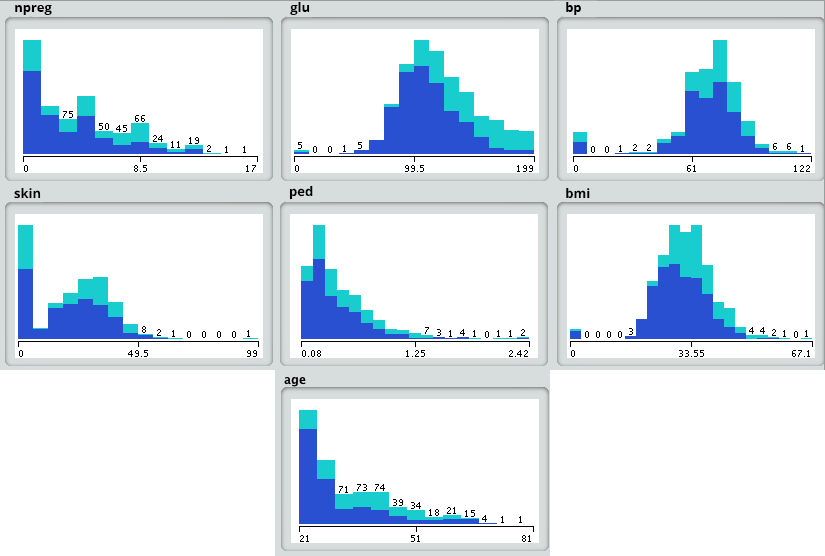
- First, we will load the data into the analytical sandbox and apply various statistical functions on it. For example, R has functions like describe which gives us the number of missing values and unique values. We can also use the summary function which will give us statistical information like mean, median, range, min and max values.
- Then, we use visualization techniques like histograms, line graphs, box plots to get a fair idea of the distribution of data.

Step 4:
Now, based on insights derived from the previous step, the best fit for this kind of problem is the decision tree. Let’s see how?
- Since, we already have the major attributes for analysis like npreg, bmi, etc., so we will use supervised learning technique to build a model here.
- Further, we have particularly used decision tree because it takes all attributes into consideration in one go, like the ones which have a linear relationship as well as those which have a non-linear relationship. In our case, we have a linear relationship between npreg and age, whereas the nonlinear relationship between npreg and ped.
- Decision tree models are also very robust as we can use the different combination of attributes to make various trees and then finally implement the one with the maximum efficiency.
Let’s have a look at our decision tree.
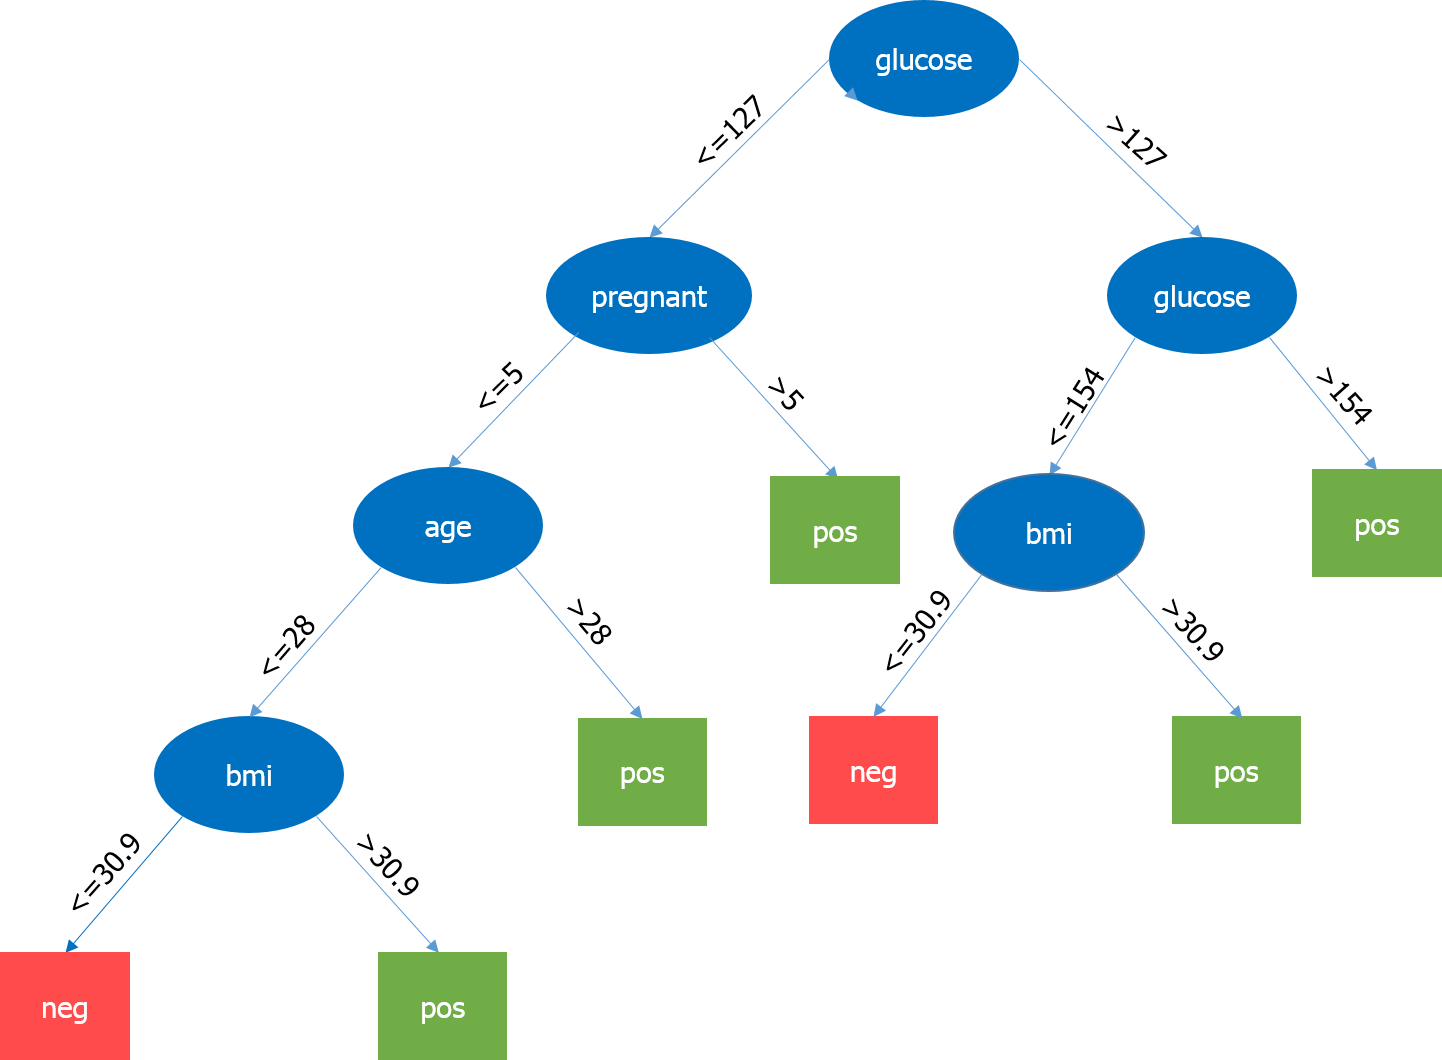

Here, the most important parameter is the level of glucose, so it is our root node. Now, the current node and its value determine the next important parameter to be taken. It goes on until we get the result in terms of pos or neg. Pos means the tendency of having diabetes is positive and neg means the tendency of having diabetes is negative.
If you want to learn more about the implementation of the decision tree, refer this blog How To Create A Perfect Decision Tree
Step 5:
In this phase, we will run a small pilot project to check if our results are appropriate. We will also look for performance constraints if any. If the results are inaccurate, we need to replan and rebuild the model.
Step 6:
Once we have executed the project successfully, we will share the output for full deployment.
ML makes computers learn the data and making own decisions and using in multiple industries. It resolves the complex problem very easily and makes well-planned management. Our MLOps online course provides certain skills to streamline this process, ensuring scalable and robust machine learning operations.
Being a Data Scientist is easier said than done. So, let’s see what all you need to be a Data Scientist. A Data Scientist requires skills basically from three major areas as shown below.
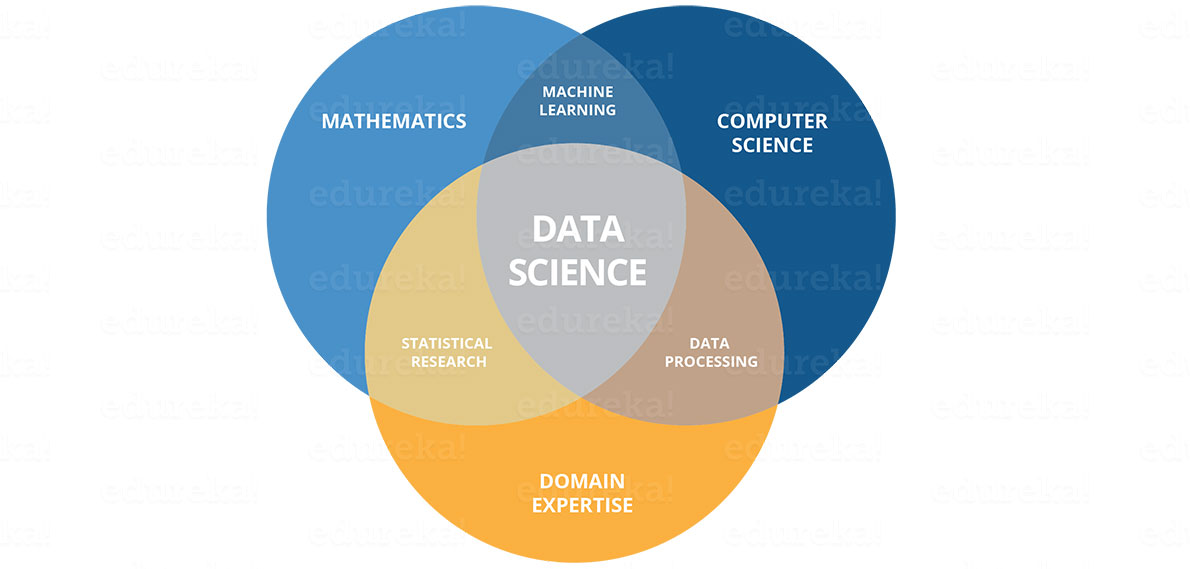

As you can see in the above image, you need to acquire various hard skills and soft skills. You need to be good at statistics and mathematics to analyze and visualize data. Needless to say, Machine Learning forms the heart of Data Science and requires you to be good at it. Also, you need to have a solid understanding of the domain you are working in to understand the business problems clearly. Your task does not end here. You should be capable of implementing various algorithms which require good coding skills. Finally, once you have made certain key decisions, it is important for you to deliver them to the stakeholders. So, good communication will definitely add brownie points to your skills. You can predict the growth of their business by incorporating data science methods in operations in the coming years, anticipate the potential for problems, and develop strategies based on data to achieve success. This is the best opportunity to kick off your career in the field of data science by taking the MS in Data Science.
Checkout Top 10 Highest Paying Jobs
In the end, it won’t be wrong to say that the future belongs to Data Scientists. It is predicted that by the end of the year 2018, there will be a need of around one million Data Scientists. More and more data will provide opportunities to drive key business decisions. It will soon change how we look at the world deluged with data around us. Therefore, a Data Scientist should be highly skilled and motivated to solve the most complex problems. Our Prompt Engineering Course covers techniques to design and refine inputs for AI models effectively.