Data Science with Python Certification Course
- 132k Enrolled Learners
- Weekend
- Live Class
(49300)


 Copy Link!
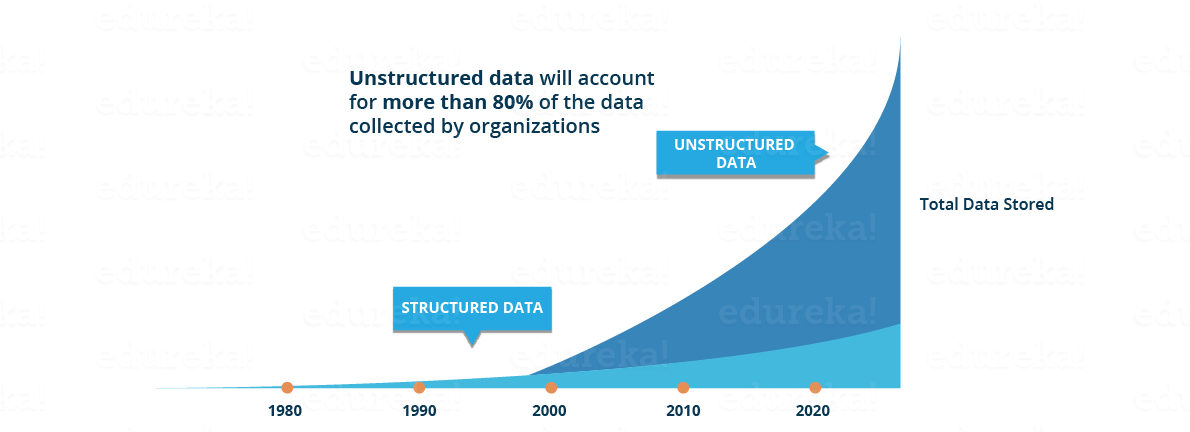
As the world entered the era of big data, the need for its storage also grew. It was the main challenge and concern for the enterprise industries until 2010. The main focus was on building a framework and solutions to store data. Now when Hadoop and other frameworks have successfully solved the problem of storage, the focus has shifted to the processing of this data. Data Science is the secret sauce here. All the ideas which you see in Hollywood sci-fi movies can actually turn into reality by Data Science. Data Science is the future of Artificial Intelligence. Therefore, it is very important to understand what is Data Science and how can it add value to your business.
By the end of this blog, you will be able to understand what is Data Science and its role in extracting meaningful insights from the complex and large sets of data all around us. To get in-depth knowledge of Data Science, you can enroll for live Data Science with Python Course by Edureka with 24/7 support and lifetime access.
Data Science is a blend of various tools, algorithms, and machine learning principles with the goal of discovering hidden patterns from the raw data. But how is this different from what statisticians have been doing for years?
The answer lies in the difference between explaining and predicting.
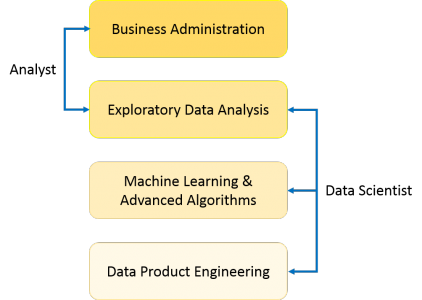
As you can see from the above image, a Data Analyst usually explains what is going on by processing history of the data. On the other hand, Data Scientist not only does the exploratory analysis to discover insights from it, but also uses various advanced machine learning algorithms to identify the occurrence of a particular event in the future. A Data Scientist will look at the data from many angles, sometimes angles not known earlier.
So, Data Science is primarily used to make decisions and predictions making use of predictive causal analytics, prescriptive analytics (predictive plus decision science) and machine learning.
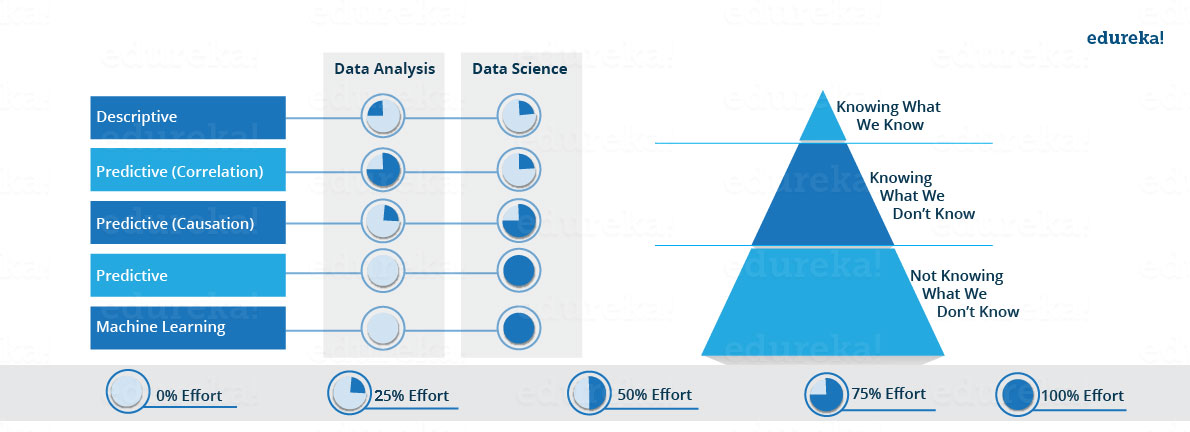
Let’s see how the proportion of above-described approaches differ for Data Analysis as well as Data Science. As you can see in the image below, Data Analysis includes descriptive analytics and prediction to a certain extent. On the other hand, Data Science is more about Predictive Causal Analytics and Machine Learning.
Now that you know what exactly is Data Science, let now find out the reason why it was needed in the first place.
Why Data Science?
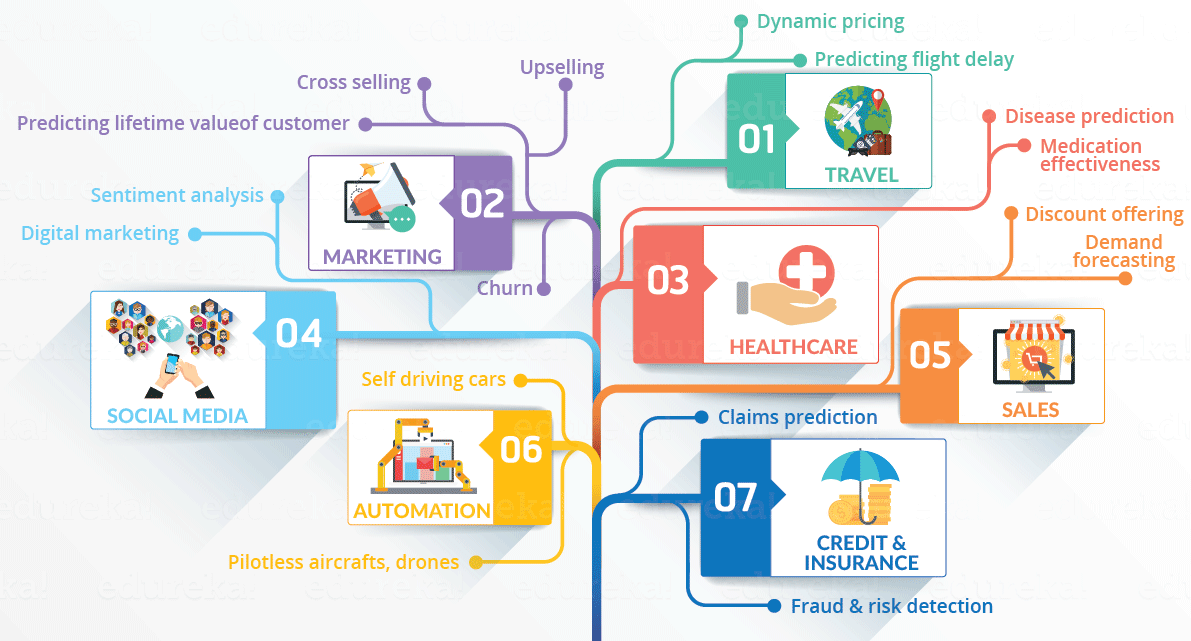
This is not the only reason why Data Science has become so popular. Let’s dig deeper and see how Data Science is being used in various domains.
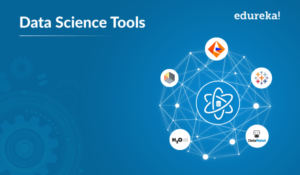
Let’s have a look at the below infographic to see all the domains where Data Science is creating its impression.
There are several definitions available on Data Scientists. In simple words, a Data Scientist is one who practices the art of Data Science. The term “Data Scientist” has been coined after considering the fact that a Data Scientist draws a lot of information from the scientific fields and applications whether it is statistics or mathematics.
Data scientists are those who crack complex data problems with their strong expertise in certain scientific disciplines. They work with several elements related to mathematics, statistics, computer science, etc (though they may not be experts in all these fields). They use the latest technologies to find solutions and reach conclusions that are crucial for an organization’s growth and development. Data Scientists present the data in a much more useful form than the raw data available to them from structured and unstructured forms.
To know more about a Data Scientist you can refer to this article on Who is a Data Scientist?
Moving further, lets now discuss BI. I am sure you might have heard of Business Intelligence (BI) too. Often Data Science is confused with BI. I will state some concise and clear contrasts between the two, which will help you better understand. Let’s have a look.
Let’s have a look at some contrasting features.
| Features | Business Intelligence (BI) | Data Science |
| Data Sources | Structured (Usually SQL, often Data Warehouse) | Both Structured and Unstructured ( logs, cloud data, SQL, NoSQL, text) |
| Approach | Statistics and Visualization | Statistics, Machine Learning, Graph Analysis, Neuro- linguistic Programming (NLP) |
| Focus | Past and Present | Present and Future |
| Tools | Pentaho, Microsoft BI, QlikView, R | RapidMiner, BigML, Weka, R |
This was all about what is Data Science, now let’s understand the lifecycle of Data Science.
A common mistake made in Data Science projects is rushing into data collection and analysis without understanding the requirements or even framing the business problem properly. Therefore, it is very important for you to follow all the phases throughout the Data Science lifecycle to ensure the project’s smooth functioning.
Explore the promising future scope of data science careers in our comprehensive guide – unlock opportunities and chart your path to success
Here is a brief overview of the main phases of the Data Science Lifecycle:
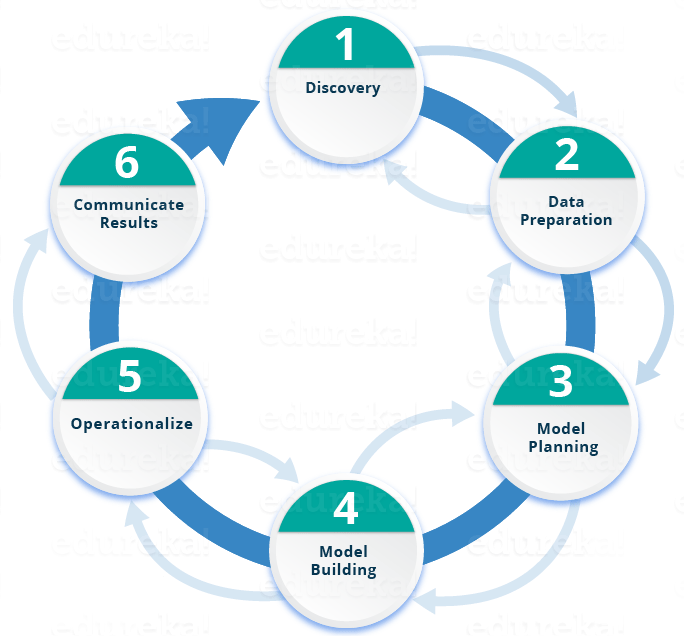
 Phase 1—Discovery: Before you begin the project, it is important to understand the various specifications, requirements, priorities and required budget. You must possess the ability to ask the right questions. Here, you assess if you have the required resources present in terms of people, technology, time and data to support the project. In this phase, you also need to frame the business problem and formulate initial hypotheses (IH) to test.
Phase 2—Data preparation: In this phase, you require analytical sandbox in which you can perform analytics for the entire duration of the project. You need to explore, preprocess and condition data prior to modeling. Further, you will perform ETLT (extract, transform, load and transform) to get data into the sandbox. Let’s have a look at the Statistical Analysis flow below.

You can use R for data cleaning, transformation, and visualization. This will help you to spot the outliers and establish a relationship between the variables. Once you have cleaned and prepared the data, it’s time to do exploratory analytics on it. Let’s see how you can achieve that.
Phase 3—Model planning:  Here, you will determine the methods and techniques to draw the relationships between variables. These relationships will set the base for the algorithms which you will implement in the next phase. You will apply Exploratory Data Analytics (EDA) using various statistical formulas and visualization tools.
Let’s have a look at various model planning tools.
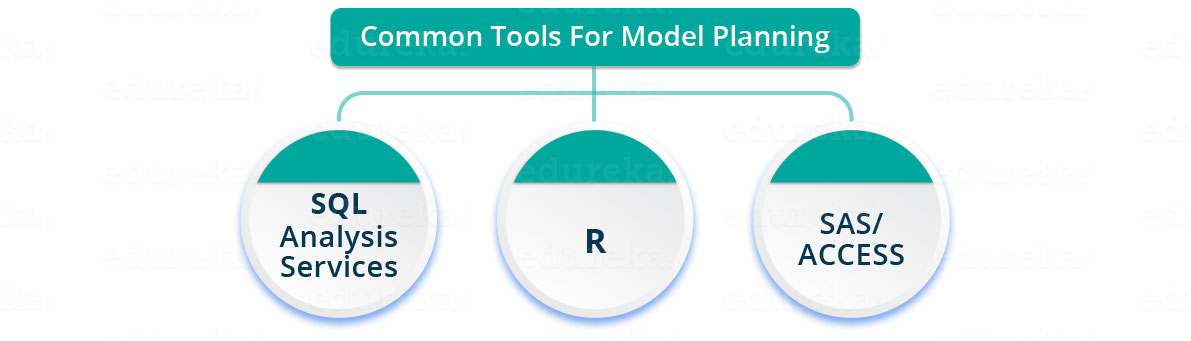
Although, many tools are present in the market but R is the most commonly used tool.
Now that you have got insights into the nature of your data and have decided the algorithms to be used. In the next stage, you will apply the algorithm and build up a model.
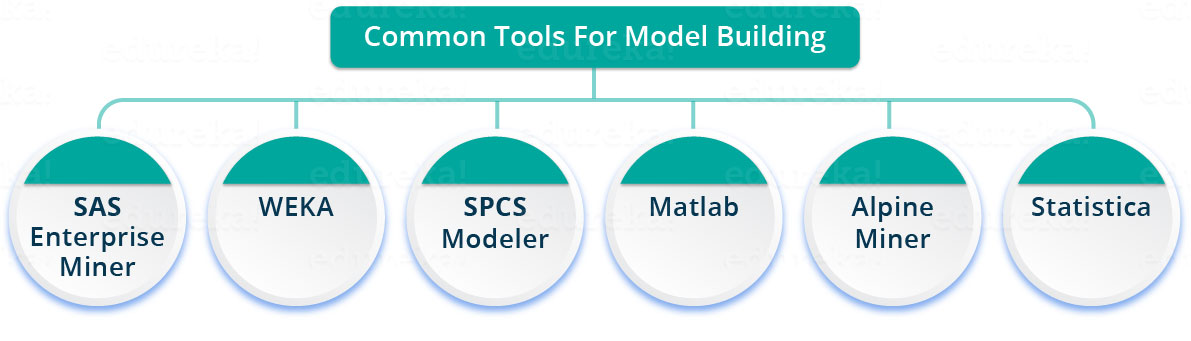
 Phase 4—Model building: You will develop datasets for training and testing purposes in this phase. Here you need to consider whether your existing tools will suffice for running the models or it will need a more robust environment (like fast and parallel processing). You will analyze various learning techniques like classification, association and clustering to build the model.
You can achieve model building through the following tools.
Phase 5—Operationalize:  In this phase, you deliver final reports, briefings, code and technical documents. In addition, sometimes a pilot project is also implemented in a real-time production environment. This will provide you a clear picture of the performance and other related constraints on a small scale before full deployment.
 Phase 6—Communicate results: Now it is important to evaluate if you have been able to achieve your goal that you had planned in the first phase. So, in the last phase, you identify all the key findings, communicate to the stakeholders and determine if the results of the project are a success or a failure based on the criteria developed in Phase 1.
Now, I will take a case study to explain you the various phases described above.
What if we could predict the occurrence of diabetes and take appropriate measures beforehand to prevent it?
In this use case, we will predict the occurrence of diabetes using the entire lifecycle we discussed earlier. Let’s go through the various steps.
Step 1:
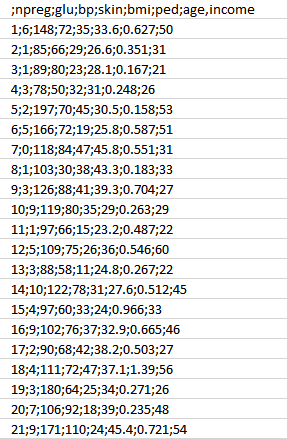
Attributes:
Step 2:
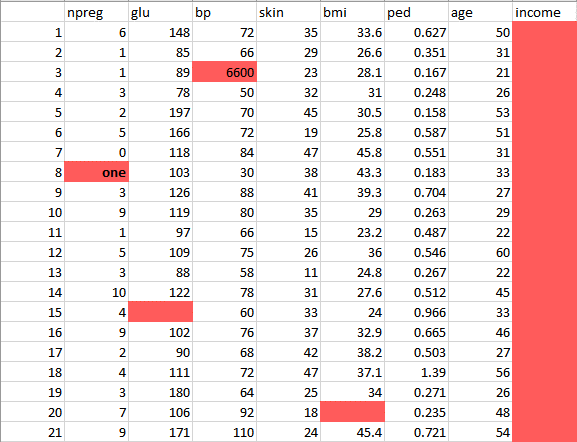
This data has a lot of inconsistencies.
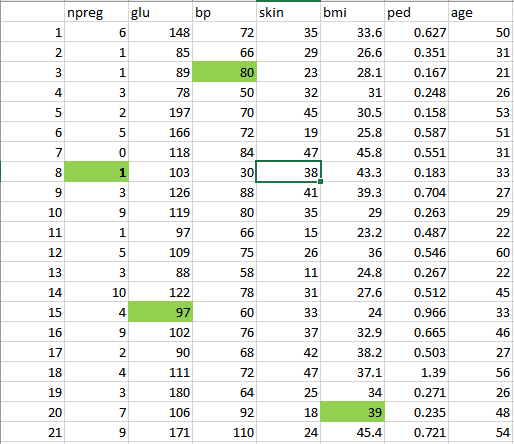
Step 3:
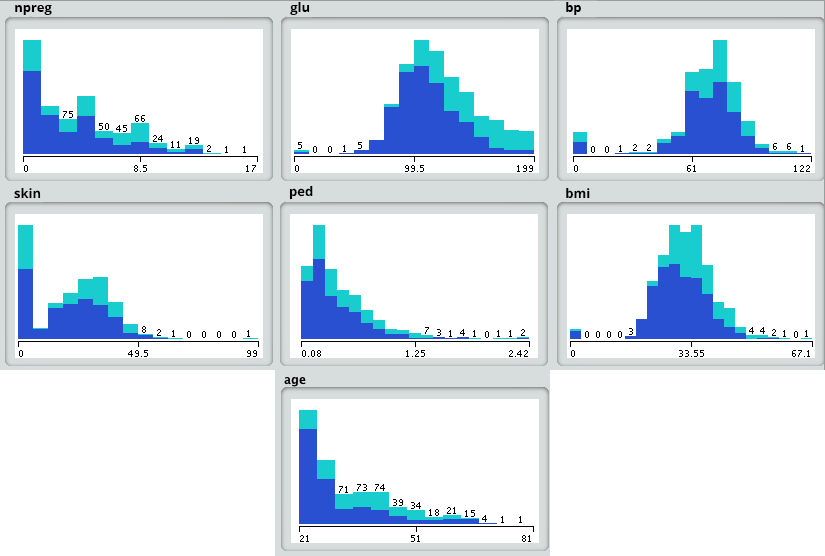
Now let’s do some analysis as discussed earlier in Phase 3.
Step 4:
Now, based on insights derived from the previous step, the best fit for this kind of problem is the decision tree. Let’s see how?
Let’s have a look at our decision tree.
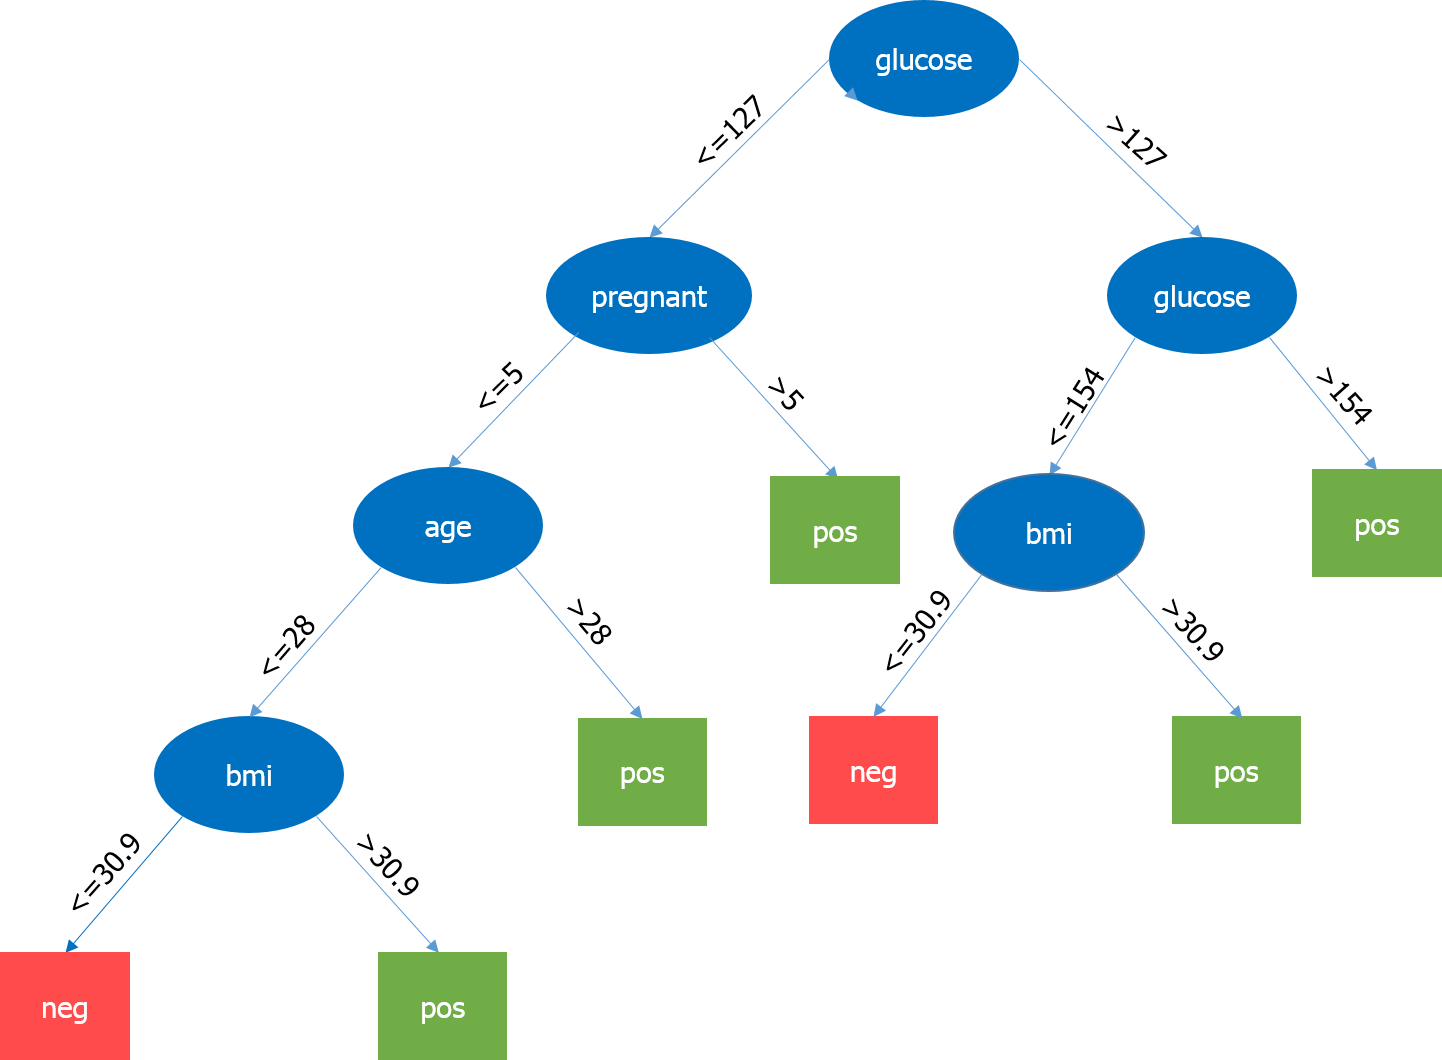
Here, the most important parameter is the level of glucose, so it is our root node. Now, the current node and its value determine the next important parameter to be taken. It goes on until we get the result in terms of pos or neg. Pos means the tendency of having diabetes is positive and neg means the tendency of having diabetes is negative.
If you want to learn more about the implementation of the decision tree, refer this blog How To Create A Perfect Decision Tree
Step 5:
In this phase, we will run a small pilot project to check if our results are appropriate. We will also look for performance constraints if any. If the results are inaccurate, we need to replan and rebuild the model.
Step 6:
Once we have executed the project successfully, we will share the output for full deployment.
ML makes computers learn the data and making own decisions and using in multiple industries. It resolves the complex problem very easily and makes well-planned management. Our MLOps online course provides certain skills to streamline this process, ensuring scalable and robust machine learning operations.
Being a Data Scientist is easier said than done. So, let’s see what all you need to be a Data Scientist. A Data Scientist requires skills basically from three major areas as shown below.
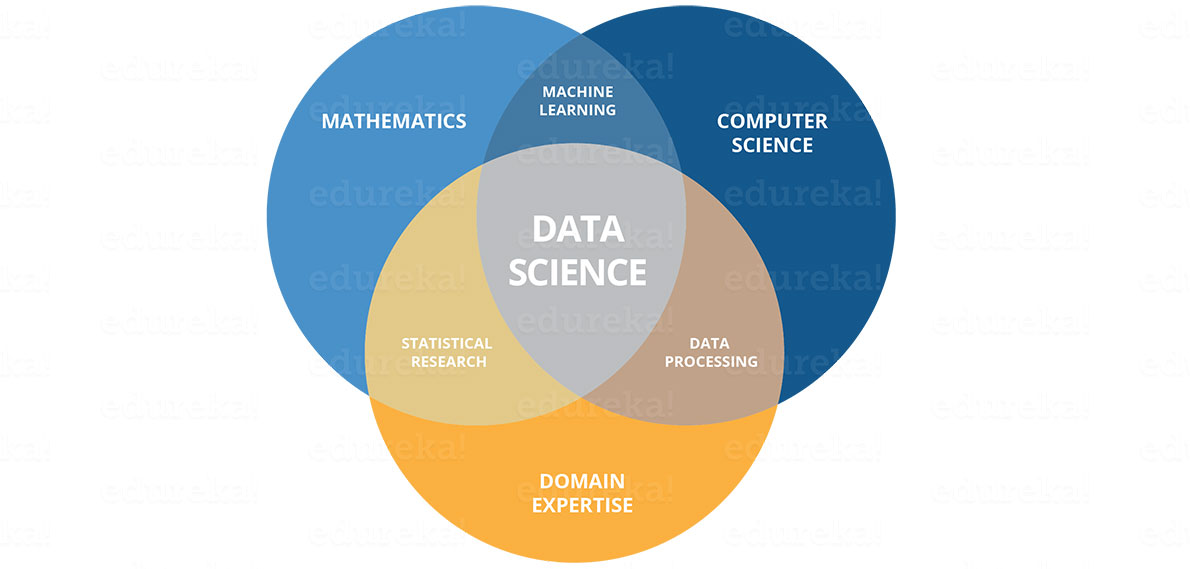
As you can see in the above image, you need to acquire various hard skills and soft skills. You need to be good at statistics and mathematics to analyze and visualize data. Needless to say, Machine Learning forms the heart of Data Science and requires you to be good at it. Also, you need to have a solid understanding of the domain you are working in to understand the business problems clearly. Your task does not end here. You should be capable of implementing various algorithms which require good coding skills. Finally, once you have made certain key decisions, it is important for you to deliver them to the stakeholders. So, good communication will definitely add brownie points to your skills. You can predict the growth of their business by incorporating data science methods in operations in the coming years, anticipate the potential for problems, and develop strategies based on data to achieve success. This is the best opportunity to kick off your career in the field of data science by taking the MS in Data Science.
In the end, it won’t be wrong to say that the future belongs to Data Scientists. It is predicted that by the end of the year 2018, there will be a need of around one million Data Scientists. More and more data will provide opportunities to drive key business decisions. It will soon change how we look at the world deluged with data around us. Therefore, a Data Scientist should be highly skilled and motivated to solve the most complex problems. Our Prompt Engineering Course covers techniques to design and refine inputs for AI models effectively.


 Thank you for registering Join Edureka Meetup community for 100+ Free Webinars each month JOIN MEETUP GROUP
Hello,
I am Pratima,
I have completed my masters in mathematics, I have started learning Python. I am completely new in this field. What should I do?
Hi
Anurag agarwal
I am post graduate in computer science , i have done my research work project on bda, data mining , hadoop 5 years back,
I have work experience of 1+ yr in L2 network protocols, but i have been out of IT industry for last 4 years.
Now i want to comeback to IT industry as it is what i have interest into , and data science is something i have alway been keen about since my post graduation days.
How the certificatation will be helpful to me getting a job in the industry again
Hi my name is anirban and I am currently working in a small finance Bank in Bangalore in risk department… So I want to know how data science will help me to advance my career in banking risk profile.
Great Post. Good to learn the difference between Data Science and Business Intelligence.
Hey Atif, we are really glad you loved our content. Do check out our other blogs too. Cheers!
What will more career growth between Data Science and Test Automation.
Hi,
I dont have knowledge of development… Can I learn Data Science?
Hi,
I have worked as Tech Lead in Microsoft Technologies(ASP.NET & SQL Server) and i am very strong in SQL.
I want to change my career path into Data Science, Let me know which course is suitable for me and how its career chances in future,
Asha Rani
hi
i want to know the scope of Data Science in the field of Library and Information Science in India.
Currently I m working as Librarian in a School..what is scope for me in Data Science field?
Hey Aasha, thank you for reading our blog. We hope you found it useful. Implementation and usage of Data Science is wide. With innovation and changing techniques leading the way, it can help you know a lot more about the reading habits of your customer. This can be leveraged in organizing and managing your books better. Scope of data science is huge, there are many other ways in which dta science can leave a lasting impact on Information Science in India. Hope this helps.Cheers :)
Hi,
In my past experience I have worked as Technical Lead for SSIS based project, it was very interesting period in my carrier. I’m very strong in SQL.
I’m currently working as Project Manager for a Digital Commerce project. Over the days i have started feeling bored about my job. I’m looking to change my domain to Data Science . Would you advise the same and the next steps please.
Thanks,
Jay
Hey Jayprakash,
We apologize for the delayed response. Yes, you can definitely think about taking up Data Science as a career option. However, to help you move into Data Science at this stage in your career, you will need to clear some certifications that will help authenticate your knowledge and expertise in this field. It is also the best way to show some credibility in front of potential employers. We provide complete live online instructor led sessions for our Data Science Certification training. You can check it out here: https://www.edureka.co/data-science-r-programming-certification-course
Hope this helps :)
Hi ,
I am currently working as Tableau developer. I have data visualization background with javascript. I am trying to find out best career path for me in big data or business intelligence path. I have strong SQL background as well.
What courses should I do. I am torn between choosing traditional business intelligence or datascience or Big data.
Which should be the best career choice for me, I am still more interested in Visulization.
Thanks
Hey Ashima, thanks for checking out our blog. Looking at your work experience and knowledge, we suggest that you take up our Data Science Course. In this course, you will get to learn R Programming in Data Science and use it for visualization.
Our Data Science course also includes the complete Data Life cycle covering Data Architecture, Statistics, Advanced Data Analytics & Machine Learning. You will learn Machine Learning Algorithms such as K-Means Clustering, Decision Trees, Random Forest and Naive Bayes. You will need some knowledge of Statistics & Mathematics to take up this course. When you sign up for this course, we provide you with complementary self-paced courses covering essentials of Hadoop, R , Statistics and Machine Learning to brush up the fundamentals required for the course. You can check out the course curriculum and sample class recording here: https://www.edureka.co/data-science-r-programming-certification-course . Hope this helps. Cheers!