


Data has been the buzzword for ages now. Either the data being generated from large-scale enterprises or the data generated from an individual, each and every aspect of data needs to be analyzed to benefit yourself from it. But how do we do it? Well, that’s where the term ‘Data Analytics’ comes in. In this blog on ‘What is Data Analytics?’, you will get an insight of this term with a hands-on.
Let’s look into the topics that will be discussed in this article:
- Why is Data Analytics important?
- What is Data Analytics?
- Top Data Analytics Tools
- How to Become a Data Analyst?
- Hands-On
Why is Data Analytics important?
Data Analytics has a key role in improving your business as it is used to gather hidden insights, generate reports, perform market analysis, and improve business requirements.

What is the role of Data Analytics?
You can refer below:
- Gather Hidden Insights – Hidden insights from data are gathered and then analyzed with respect to business requirements.
- Generate Reports – Reports are generated from the data and are passed on to the respective teams and individuals to deal with further actions for a high rise in business.
- Perform Market Analysis – Market Analysis can be performed to understand the strengths and weaknesses of competitors.
- Improve Business Requirement – Analysis of Data allows improving Business to customer requirements and experience.
Now that you know the need for Data Analytics, let me quickly elaborate on what is Data Analytics for you.
What is Data Analytics for Beginners?

Data Analytics refers to the techniques used to analyze data to enhance productivity and business gain. Data is extracted from various sources and is cleaned and categorized to analyze various behavioral patterns. The techniques and the tools used vary according to the organization or individual.
So, in short, if you understand your Business Administration and have the capability to perform Exploratory Data Analysis, to gather the required information, then you are good to go with a career in Data Analytics.
So, now that you know what is Data Analytics, let me quickly cover the top tools used in this field.
What are the tools used in Data Analytics?
With the increasing demand for Data Analytics in the market, many tools have emerged with various functionalities for this purpose. Either open-source or user-friendly, the top tools in the data analytics market are as follows.
- R programming – This tool is the leading analytics tool used for statistics and data modeling. R compiles and runs on various platforms such as UNIX, Windows, and Mac OS. It also provides tools to automatically install all packages as per user-requirement.
- Python – Python is an open-source, object-oriented programming language that is easy to read, write, and maintain. It provides various machine learning and visualization libraries such as Scikit-learn, TensorFlow, Matplotlib, Pandas, Keras, etc. It also can be assembled on any platform like SQL server, a MongoDB database or JSON
- Tableau Public – This is a free software that connects to any data source such as Excel, corporate Data Warehouse, etc. It then creates visualizations, maps, dashboards etc with real-time updates on the web.
- QlikView – This tool offers in-memory data processing with the results delivered to the end-users quickly. It also offers data association and data visualization with data being compressed to almost 10% of its original size.
- SAS – A programming language and environment for data manipulation and analytics, this tool is easily accessible and can analyze data from different sources.
- Microsoft Excel – This tool is one of the most widely used tools for data analytics. Mostly used for clients’ internal data, this tool analyzes the tasks that summarize the data with a preview of pivot tables.
- RapidMiner – A powerful, integrated platform that can integrate with any data source types such as Access, Excel, Microsoft SQL, Tera data, Oracle, Sybase etc. This tool is mostly used for predictive analytics, such as data mining, text analytics, machine learning.
- KNIME – Konstanz Information Miner (KNIME) is an open-source data analytics platform, which allows you to analyze and model data. With the benefit of visual programming, KNIME provides a platform for reporting and integration through its modular data pipeline concept.
- OpenRefine – Also known as GoogleRefine, this data cleaning software will help you clean up data for analysis. It is used for cleaning messy data, the transformation of data and parsing data from websites.
- Apache Spark – One of the largest large-scale data processing engine, this tool executes applications in Hadoop clusters 100 times faster in memory and 10 times faster on disk. This tool is also popular for data pipelines and machine learning model development.
Now, that you know all this about Data Analysis, let me tell you what you can become by gaining knowledge about this field.
Well, you can become a well-renowned Data Analyst. Now, if you ask me Who is a Data Analyst?, then my answer would be that a Data Analyst is a professional who can analyze data by applying various tool and techniques and gathering the required insights.
So, let’s now discuss how you can become a Data Analyst?
How to Become a Data Analyst?
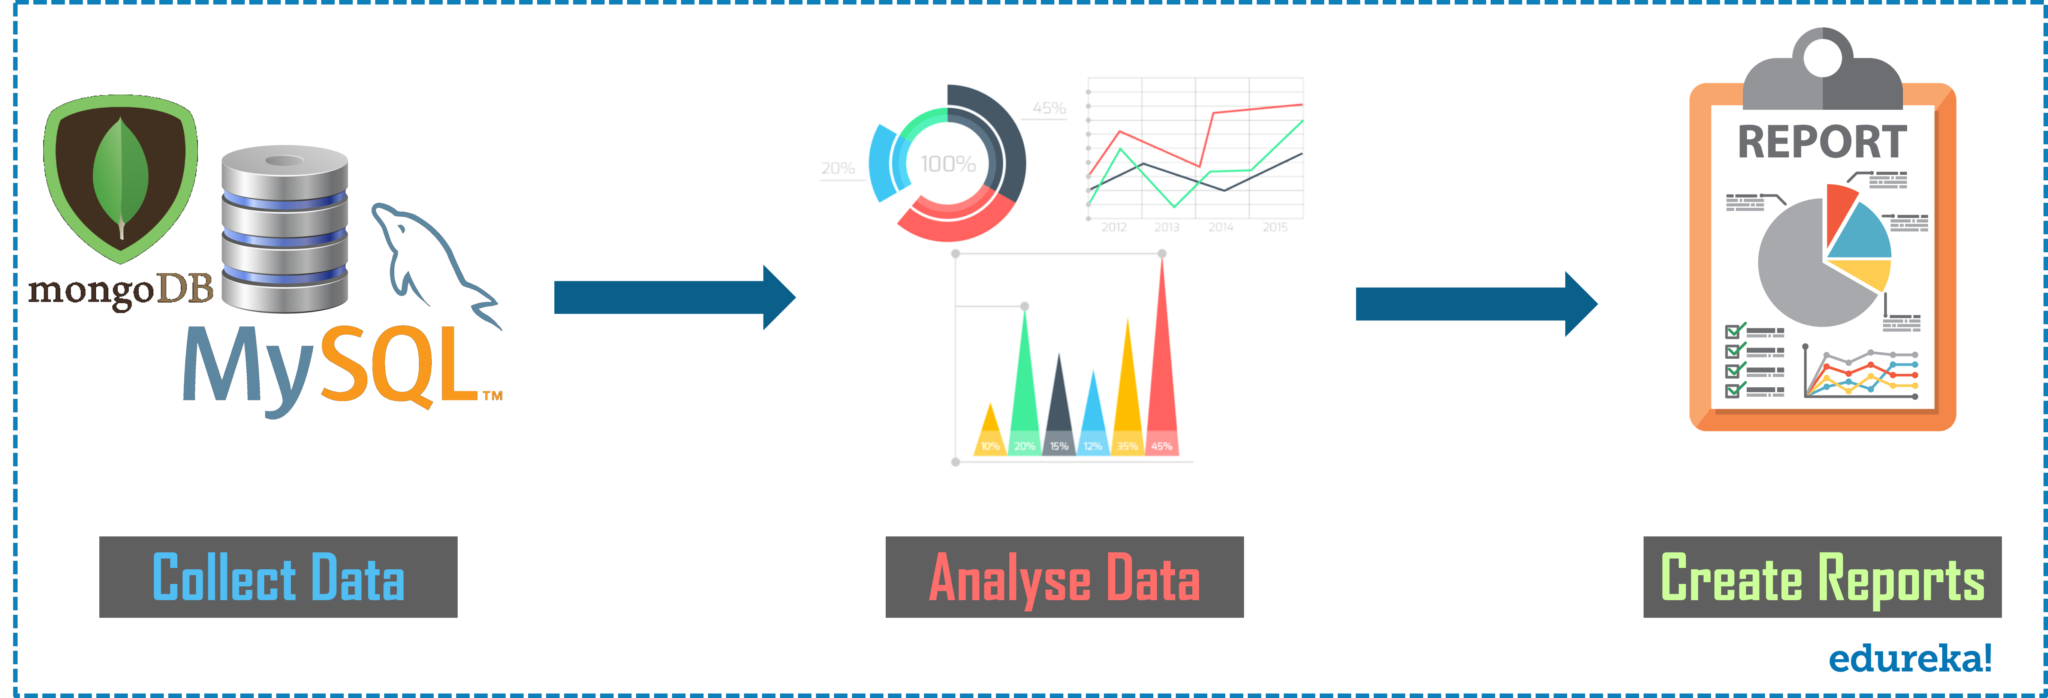
Data analysts translate numbers into plain English. A Data Analyst delivers value to their companies by taking information about specific topics and then interpreting, analyzing, and presenting findings in comprehensive reports. So, if you have the capability to collect data from various sources, analyze the data, gather hidden insights, and generate reports, then you can become a Data Analyst. Refer to the image below:

Apart from the above-mentioned capabilities, a Data Analyst should also possess skills such as Statistics, Data Cleaning, Exploratory Data Analysis, and Data Visualization. Also, if you have a knowledge of Machine Learning, then that would make you stand out from the crowd.
On average, a Data Analyst can expect a salary of ₹404,660 (IND) or $83,878 (US). As experts, data analysts are often called on to use their skills and tools to provide competitive analysis and identify trends within industries. If you wish to know more about the Salary trends of a Data Analyst, then you can read our full article on Data Analyst Salary.
So, now that you know a handful about Data Analytics, let me show you a hands-on in R, where we will analyze the data set and gather some insights.
What is Data Analytics with Examples: Hands-On
The following is an example of data analytics, where we will be analyzing the census data and solving a few problem statements.
Dataset Structure:
The dataset has the following columns:
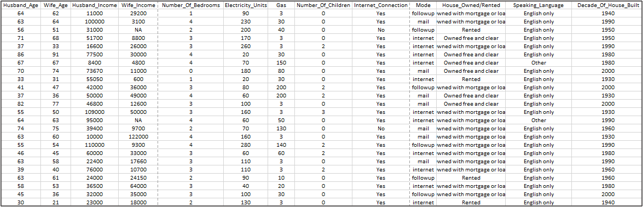

- House_number
- Husband_Age
- Wife_Age
- Husband_Income
- Wife_Income
- Number_Of_Bedrooms
- Electricity_Units
- Gas
- Number_Of_Children, Internet_Connection
- Mode
- House_Owned/Rented, Speaking_Language
- Decade_Of_House_Built.
Problem Statement:
To find out the following:
- Know the minimum, maximum and average Age of Wife
- Know the median, quantile, variance and standard deviation of Husband Income
- Find the frequency of Number of Children and Number of Bedrooms
Solution:
The steps we are going to follow are as follows:
- Import the Dataset
- Perform Data Cleaning
- Calculate the Min, Max, and Mean for Wife Age
- Calculate the Median, Quantile, Variance, Standard Deviation for Husband Income
- Plot the data for the number of children and number of bedrooms
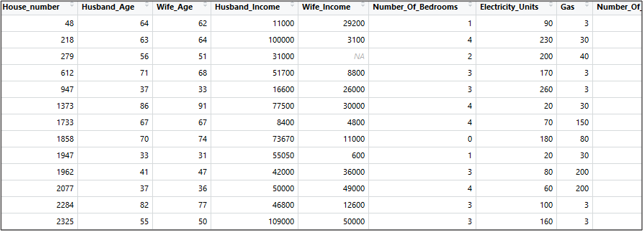
Step 1: To import the data set you can use the read.csv command and mention the path of the CSV file to be read. After that assign this CSV file to a variable for the future use purpose. Here I have assigned it to sampledata.
#Importing Dataset
sampledata <- read.csv("C:/Users/Sahiti/Desktop/Census_Data.csv")
Step 2: Now, you can view your data set, by using the View command and the variable’s name.
View(sampledata)

#Replacing NA Values with 0
sampledata[is.na(sampledata)]<- 0
Now, if you view dataset again, you would find that all the NA values are replaced with 0. You can use the View (sampledata) to do so.
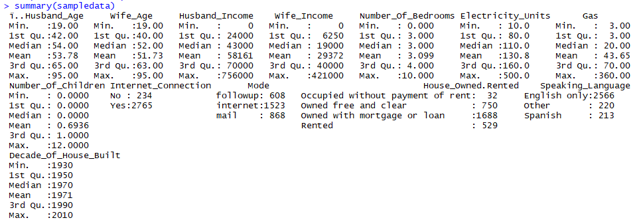
Step 4: Now, that all the null values are removed, use the summary function to get the summary of the dataset.
#summary of dataset
summary(sampledata)

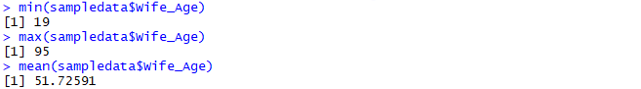
#To calculate the min, max, and mean of Wife_Age
min(sampledata$Wife_Age)
max(sampledata$Wife_Age)
mean(sampledata$Wife_Age)

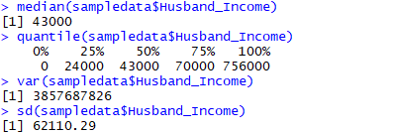
Step 6: Now, to calculate the median, quantile range, variance and the standard deviation of Husband_Income you can use the inbuilt functions (median, quantile, var, sd) as follows.
#To calculate the median, quantile,variance, standard deviation of Husband_Income
median(sampledata$Husband_Income)
quantile(sampledata$Husband_Income)
var(sampledata$Husband_Income)
sd(sampledata$Husband_Income)

Step 7: Now, to plot the number of children and number of bedrooms, you can use the histogram and bar plot.
#To plot the number of children
hist(sampledata$Number_Of_Children)
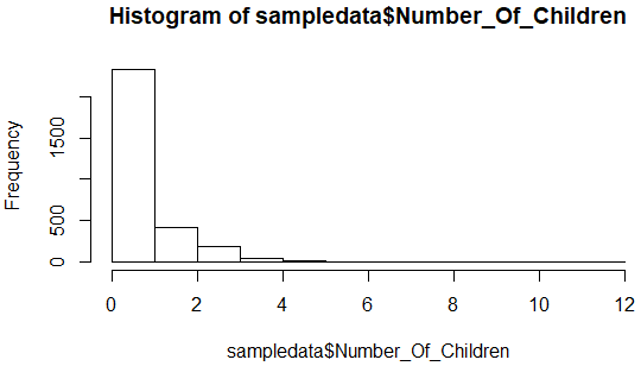

As you can clearly see in the above plot, the frequency of the number of children between 0-2 stands the highest.
Now, to find the number of bedrooms, I have assigned the number of bedrooms to a table, which is again assigned to a variable countofbedrooms.
#To plot the number of bedrooms.
countofbedrooms <- table(sampledata$Number_Of_Bedrooms)
barplot(countofbedrooms, main="Bedrooms Distribution", xlab="Number of Bedrooms")
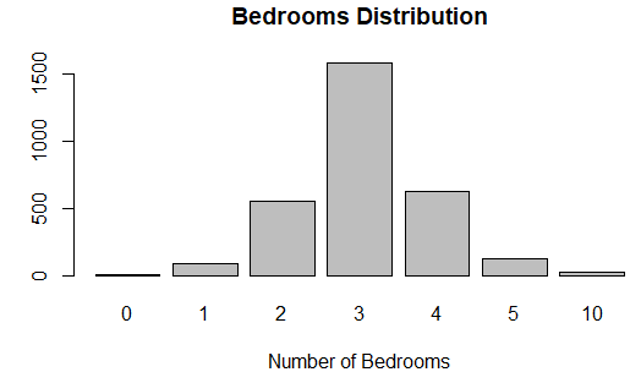

As you can see in the above plot, the number of bedrooms 3 stands the highest.
So, folks, with this, we come to the end of this ‘What is Data Analytics?’ article. If you are someone looking to get into an interesting career, now would be the right time to up-skill and take advantage of the Data Analysis career opportunities that come your way.
Edureka has a specially curated Data Analytics Master Program that will make you proficient in tools and systems used by Data Analytics Professionals. It includes in-depth training on Statistics, Data Analytics with R, SAS, and Tableau. The curriculum has been determined by extensive research on 5000+ job descriptions across the globe.
Got a question for us? Please mention it in the comments section of the “What is Data Analytics?” article and we will get back to you.