
Advanced Power BI Certification Course with G ...
- 13k Enrolled Learners
- Weekend/Weekday
- Live Class
(4230)
QlikView is considered to be the most flexible business intelligence platforms for data visualization that business analysts and business intelligence (BI) developers can use to create advanced BI apps. It is not only fast to deploy and easy to learn, but also improves data visualization practices.
This webinar traces the history of Qlikview besides delving into why it is better than traditional BI tools. It also talks about the following in detail:
Founded in Sweden in 1993 by Björn Berg and Staffan Gestrelius, it was originally called Quikview: Quality, Understanding, Interaction, Knowledge. Initially, designed to mimic the way a human brain functions, it had two versions written in Excel using VLOOKUPs. Today, with a market capitalization of $2.5 billion, over 24,000 customers spread across 100 countries are using Qlikview to consolidate, search, and visually analyse all their data.
Qlikview, a single application platform for all BI needs, is helping companies across the globe with unprecedented business insight. It is helping businesses to make smarter, faster decisions because of the following reasons:

Qlikview’s in-memory architecture eliminates the problems plaguing the traditional BI tools that deliver static data. It takes all the data via Excel or other sources, calculates and loads everything in the memory. After the data loads, it goes to the RAM memory of the system. This helps Qlikview to respond faster.
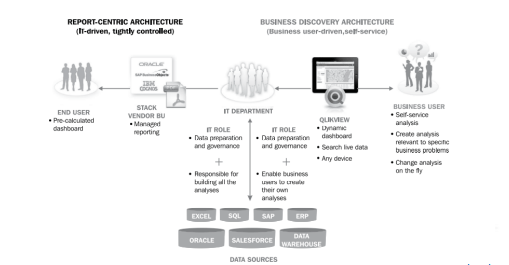
Qlikview allows data to be pulled easily as it doesn’t need data to be stored in cubes or data warehouses. It also becomes easier for analysts or business users to quickly get an understanding of the tool, as scripting and writing formulas in this application is similar to Excel. This helps users to generate reports swiftly and give faster solution to the end-users. Any implementation of change is comparatively fast.

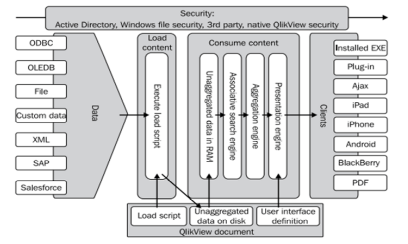
There are different kinds of data layers from where you can fetch the data from different data sources available today. You can then load the components in the memory via the load script. In a nutshell, Qlikview architecture works right from data integration, data modelling to presentation.
Associative User Experience in QlikView allows users to conduct direct as well as indirect searches across all data in the application, worldwide or within a single filed.
Several companies across the globe today like banking conglomerate, e-commerce, consulting or manufacturing companies have been using this application and benefiting from it.
The graphic below shows some of the major companies using it:
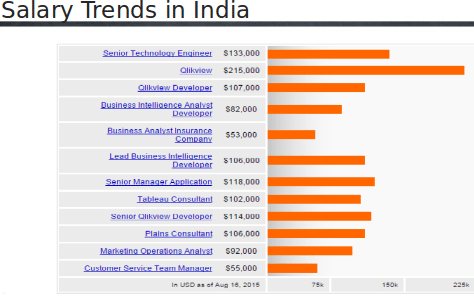
Let’s take a look at the salary trends in India:
How do we write MDX to fetch data or calculate in Qlikview?
You can write all your small scripts which works as small cubes in Qlikview. When you load all the data it puts everything in the engine, which you can fetch into the front end. You can do all the calculation in the front end within the chart or in the matrix.
Tableau VS Qlikview VS R
It depends on what kind of solution you are building. Tableau and Qlikview provide a similar functionality, where it allows you to put your dashborads and reports to your users, in such a way that you are putting across a story. Whereas R is used by statisticians for statistical analysis. It has the capability of creating graphics and reports as well. Qlikview has a robust and good scripting technology. While in Tableau, you simply load the data and start your visualization.
Can we connect different sources of data at the same time or in a single connection?
You can connect the data with one of its sources. You have the flexibility of specifying multiple connections, but only one connection will be active at a time.
How do we access Qlikview sheets or dashboard in web application?
In web application, Qlikview provides the components which you can use to include the Qlikview application. But you can do this only via its server. You need to have a server where you have published the application and you can use this via the link which the server produces. You need to have an active X component which is related to Qlikview end-user view which needs to be installed in your system.
Here’s the PPT presentation:
Related Posts:


 Thank you for registering Join Edureka Meetup community for 100+ Free Webinars each month JOIN MEETUP GROUP