


Advanced Power BI Certification Course with G ...
- 13k Enrolled Learners
- Weekend
- Live Class
(4230)


 Copy Link!
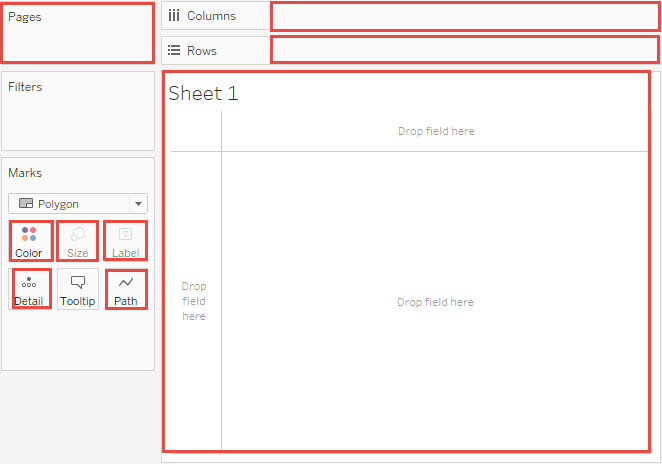
Table Calculations are basically a special type of field that computes on the local data. The following article is going to take you through all you need to know to start using Table Calculations in Tableau.
Now, because of its utility to beginners, it makes for a very essential module in most Tableau Training Curriculum.
Table calculations in Tableau are basically transformations you apply to the values in a visualization. They are calculated based on what is currently in the visualisation and do not consider any measures or dimensions that are filtered out of the visualization.
You can use table calculations to transform values in ways including but not limited to:
Rankings
Running totals
Per cent of total
For all charts in Tableau, there is a virtual table that is determined by certain dimensions in the view. This table is not the same as the tables in your data source. Specifically, the virtual table is determined by the dimensions within the level of detail in a Tableau worksheet.
When you add a table calculation, you must use all dimensions in the level of detail either for partitioning/scoping or for addressing/direction.
The dimensions that define the scope of data it is performed on are called partitioning fields. The table calculation is performed separately within each partition.
Partitioning fields break the view up into multiple sub-views (or sub-tables), and then the table calculation is applied to the marks within each such partition.
The remaining dimensions, upon which the table calculation is performed, are called addressing fields, and determine the direction of the calculation.
The direction in which the calculation moves (for example, in calculating a running sum) is determined by the addressing fields. So when you order the fields in the Specific Dimensions section of the Table Calculation dialogue box from top to bottom, you are specifying the direction in which the calculation moves through the various marks in the partition.
Basically, when you add a table calculation using the Compute Using options, Tableau identifies these dimensions automatically, as a result of your selections. But when you want to determine which dimensions are for addressing and which for partitioning, you need to use Specific Dimensions.
In the following table, the calculation is computed across columns YEAR(Order Date) for every row MONTH(Order Date).

In the following table, the calculation is computed down rows MONTH(Order Date) for every column YEAR(Order Date).

In the following table, the calculation is computed across columns YEAR(Order Date), down a row MONTH(Order Date), and then across columns again for the entire table.

In the following table, the calculation is computed down rows MONTH(Order Date), across a column YEAR(Order Date), and then down rows again.

For example, in the following table, the calculation is computed down rows MONTH(Order Date) for a single pane.

In the following table, the calculation is computed across columns YEAR(Order Date) for the length of the pane, down a row MONTH(Order Date), and then across columns for the length of the pane again.

In the following table, the calculation is computed down rows MONTH(Order Date) for the length of the pane, across a column YEAR(Order Date), and then down the length of the pane again.


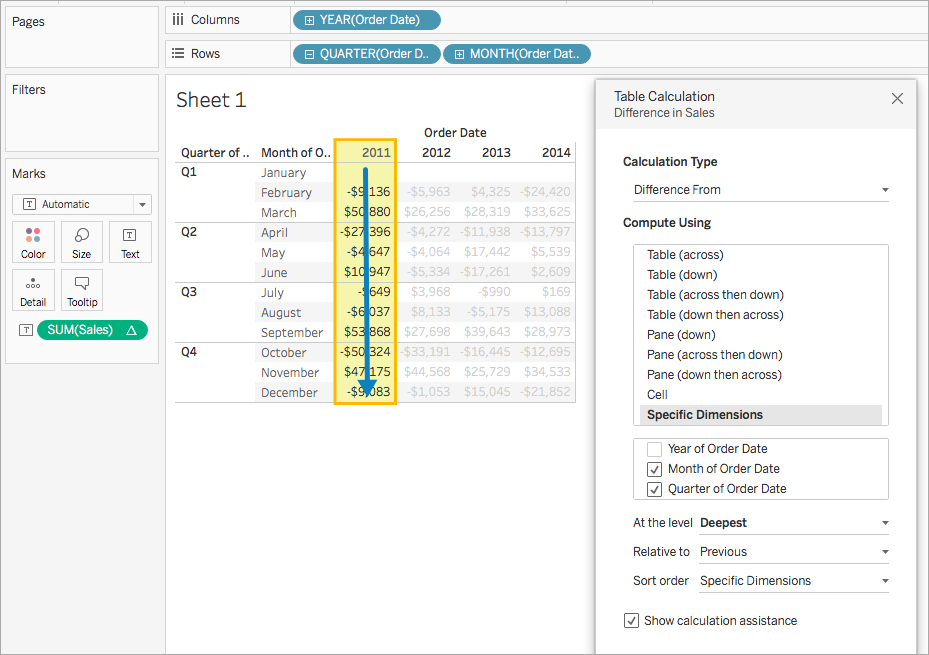
In the following visualisation the dimensions, Month of Order Date and Quarter of Order Date, are the addressing fields selected, and Year of Order Date is the partitioning field since it is not selected.
So, the calculation transforms the difference from each month across all quarters within a year. The calculation starts over for every year. Uncover the versatility of Tableau functions and transform your data analysis capabilities with our comprehensive guide.
Also, if all dimensions are selected, then the entire table is in scope.
The At the level option is only available when you select Specific Dimensions in the Table Calculations dialogue box, and when more than one dimension is selected in the field immediately below the Compute Using options —that is, when more than one dimension is defined as an addressing field.
Open Tableau Desktop and connect to the Sample-Superstore and navigate to a new worksheet.
In the Data pane, under Dimensions, drag Order Date to the Rows shelf. The dimension updates to YEAR(Order Date).
On the Rows shelf, right-click YEAR(Order Date) and select Quarter.
On the same shelf, click the + icon on QUARTER(Order Date) and the MONTH(Order Date) is added to the shelf.
From under the Dimensions again, drag Order Date to the Columns shelf. The dimension updates to YEAR(Order Date) again.
Go to Measures, drag Sales to Text on the Marks card. It looks like the following image;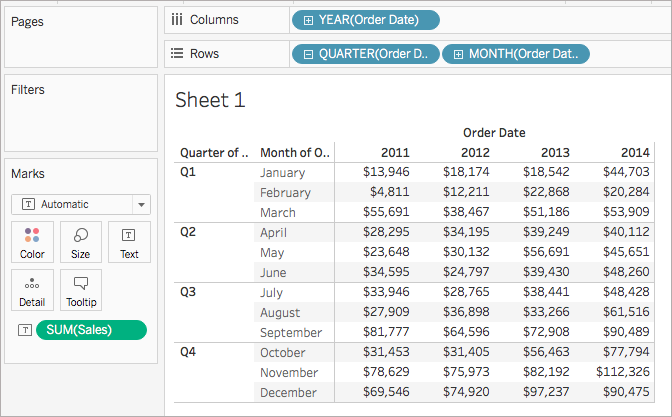
On the Marks card, right-click SUM(Sales) and select Add Table Calculation.
In the Table Calculation dialogue box;
For Calculation Type, select Difference From.
For Compute Using, select Table (across).
When finished, exit the dialogue box and check your work.

Right-click the measure in the view which the table calculation is applied and select the Edit Table Calculation.
In the dialogue box that appears, make desired changes.
When finished, exit the dialogue box.
Right-click the measure in the view which the table calculation is applied to and select Clear Table Calculation. This removes the table calculation from the measure and the visualisation updates with its original values.
That’s all folks! This is all you need to know to begin with Table Calculations.
To know more about Tableau, you could check out Edureka’s Tableau Certification which covers various concepts of data visualization in ample depth to get you ready for the industry. It includes concepts such as conditional formatting, scripting, linking charts, dashboard integration, Tableau integration with R and more. It also comes with 24*7 support to guide you throughout your learning period.


 Thank you for registering Join Edureka Meetup community for 100+ Free Webinars each month JOIN MEETUP GROUP