


Advanced Power BI Certification Course with G ...
- 13k Enrolled Learners
- Weekend/Weekday
- Live Class
(4230)


 Copy Link!
Tableau is a popular visualization tool that most organizations and IT companies use to evaluate their data. Tableau projects help you to connect with several data sources, analyze data, and visualize it to get superior insights. It’s a popular Business Analysts frequently use Tableau projects to share the processed data with other users throughout the enterprise and engage with the results in real-time. They collect data from many sources and translate it into useful information that can be utilized to make data-driven choices.
If you’re new to Tableau, I recommend checking out the videos on Tableau available on the Edureka YouTube Channel for a clear understanding. To study data analytics and business intelligence, you must first grasp the fundamental ideas.
We’ve put up a step-by-step guide to Tableau Projects for any layman who is completely new to this technology.
So, whether you’ve taken a Tableau course or learnt on your own and are searching for how to create a Project on Tableau, this is the article for you.
This blog talks about what are Tableau Projects and how to get started with it. We will cover the following topics in this blog.
Tableau projects assist you in mastering the numerous tools used in data visualization and optimizing the data interpretation according to the requirement of the customer.
Having several Projects on Tableau in your hands will undoubtedly boost your knowledge, develop your abilities, and make your CV stand out from the crowd, regardless of whether you’ve completed any Tableau certifications or acquired it on your own.
The datasets for these projects on Tableau may be downloaded from the Tableau website. You may look at examples on the official website to learn more about the capabilities and benefits of various tools in tableau. We’ll teach you how to develop Tableau projects for practice by importing data and translating it into useful insights in this blog.
Few basic requirements for your dashboards to have in your project are:
To gain the maximum amount of insight with the least amount of effort is what we try to achieve through B…
Designing Tableau projects will help you to gain a strong foundation in data management and analysis. Tableau projects can help you practise the following five abilities. Remember that mastering Tableau will provide you with a well-rounded set of applicable skills.
Data Analysis: Working with projects on Tableau requires a significant amount of data analysis. You’ll work with a variety of data sets and answer questions that are essential to business choices. As a result, you’ll have a strong foundation in statistical and mathematical principles.
Data Visualization: Tableau projects will also assist you in strengthening your data visualization abilities. You’ll have a better understanding of properties and chart formats.
Business Decisions: Business intelligence is a term that refers to the study of data. Tableau projects will also introduce you to various data mining, data tools, and process principles. These are crucial ideas in the field of business intelligence. You’ll be able to make more data-driven judgments and increase a company’s revenues.
RDBMS: You will gain knowledge and abilities in several relational database management systems as part of projects on Tableau (RDBMS). MySQL, Oracle, and Microsoft SQL Server Database are the most popular RDBMS.
Data Modelling: Data modelling is a technique for analyzing data. You’ll also learn how to model data. Tableau projects works with a variety of data sets. To speed up the process, you’ll work using data modelling approaches. You will practice supplying improved and ordered data for analysis in this respect.
Simplify and streamline your data preparation process. Learn how to clean, shape, and merge your data effortlessly with Tableau Prep Builder, and get your insights faster.
As a beginner, projects on Tableau will assist you in mastering the many tools used in data visualization and optimizing the outcomes depending on client needs.
Having several projects in your hands will undoubtedly boost your knowledge, develop your abilities, and make your CV stand out from the crowd, whether you’ve taken any tableau certifications or acquired it on your own.
Tableau Projects for Beginners:
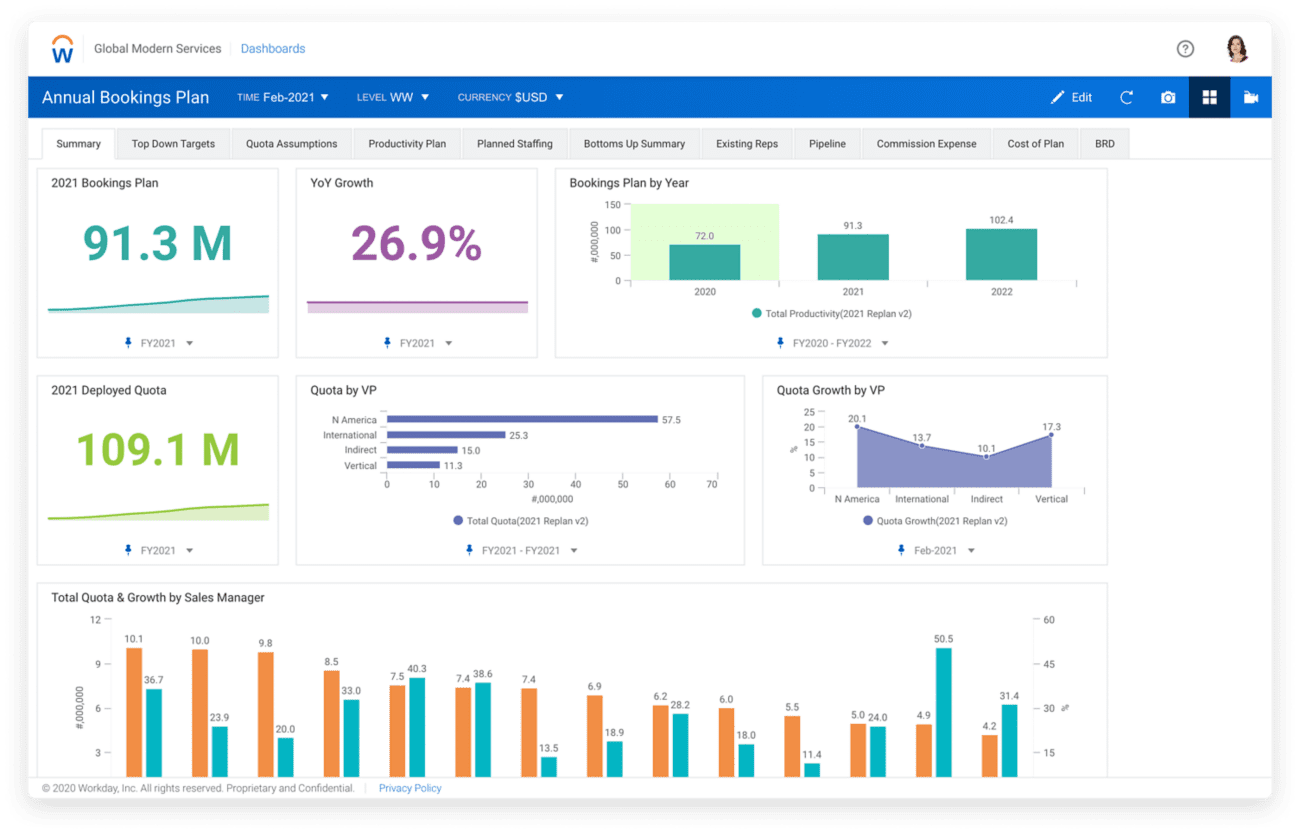
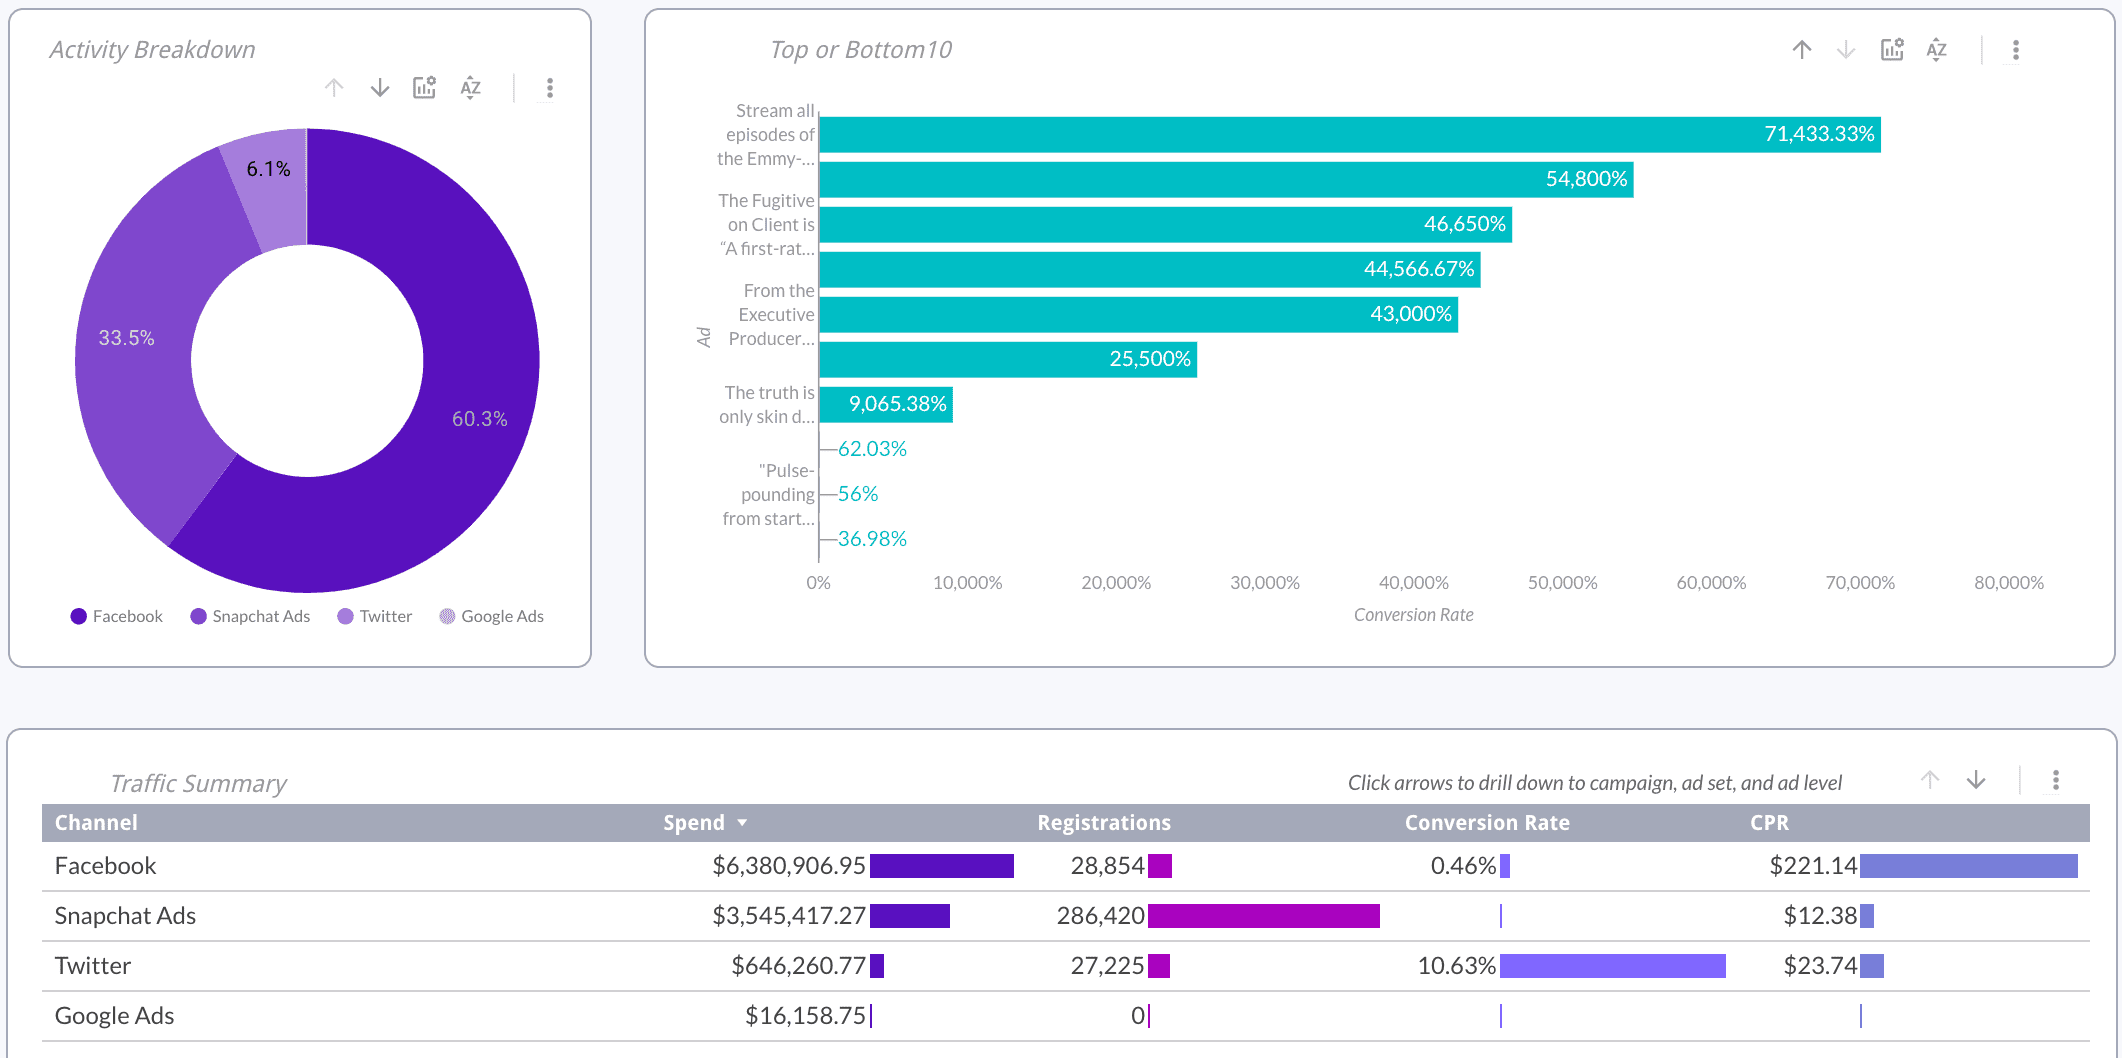
Sales Forecast Analysis Dashboard
Since it contains forecasting, this example of project in Tableau is included in the Data Analysis and Data Science project. The problem statement here is to assess a company’s sales data. The project’s main goal is to infer a company’s previous sales data and then anticipate its sales for the following quarters and years. Tableau may be used to make basic bar charts for sales forecasting. Once it is completed, modelling may be used to estimate future sales patterns.
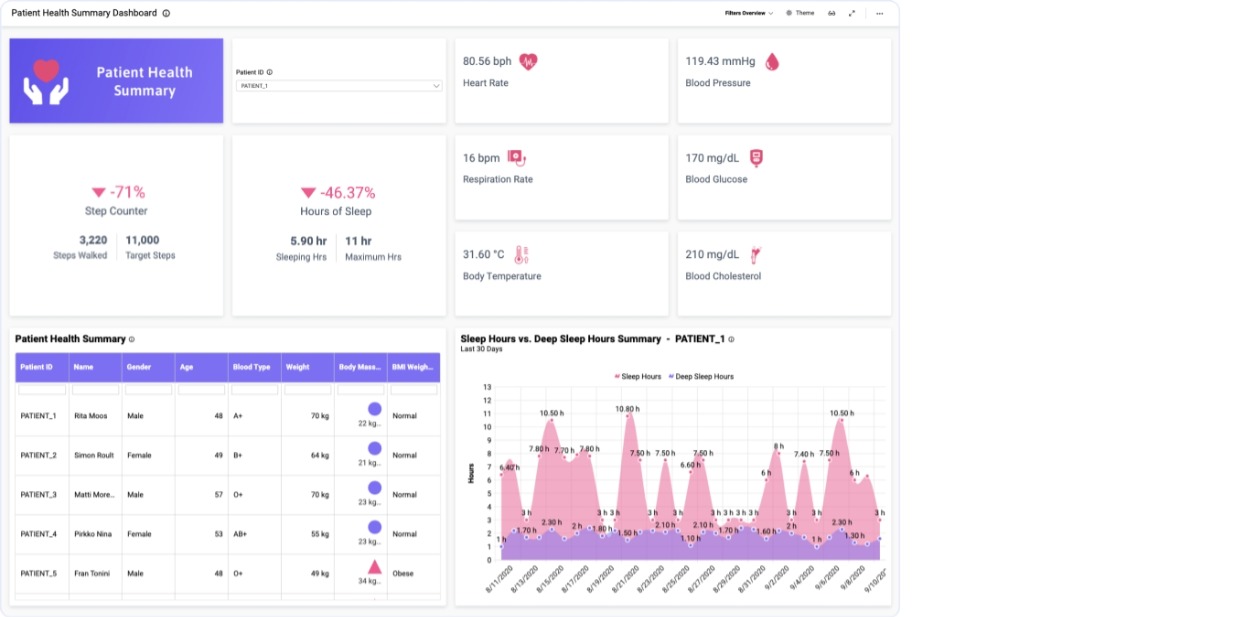
 Patient Risk Healthcare Dashboard
This Tableau project idea for beginners comes from the healthcare industry. When dealing with large datasets, this project will assist you in improving your data skills. The project comprises gathering and integrating patient data from a single hospital into Tableau. You should be able to recognize and forecast any health concerns as a result of the project.
Tableau is an excellent tool for managing large datasets. It may be used for data collection, analysis, and visualization. The greater the number of variables, the easier it is to comprehend and make predictions.
This might be part of a Data Analysis or Data Science project that involves predictive analysis. The challenge statement is to examine a large dataset of patients at a certain hospital and forecast and infer their health risk based on their data. After that, you should integrate all of this data into Tableau for end-user consumption.
 Intermediate Projects:
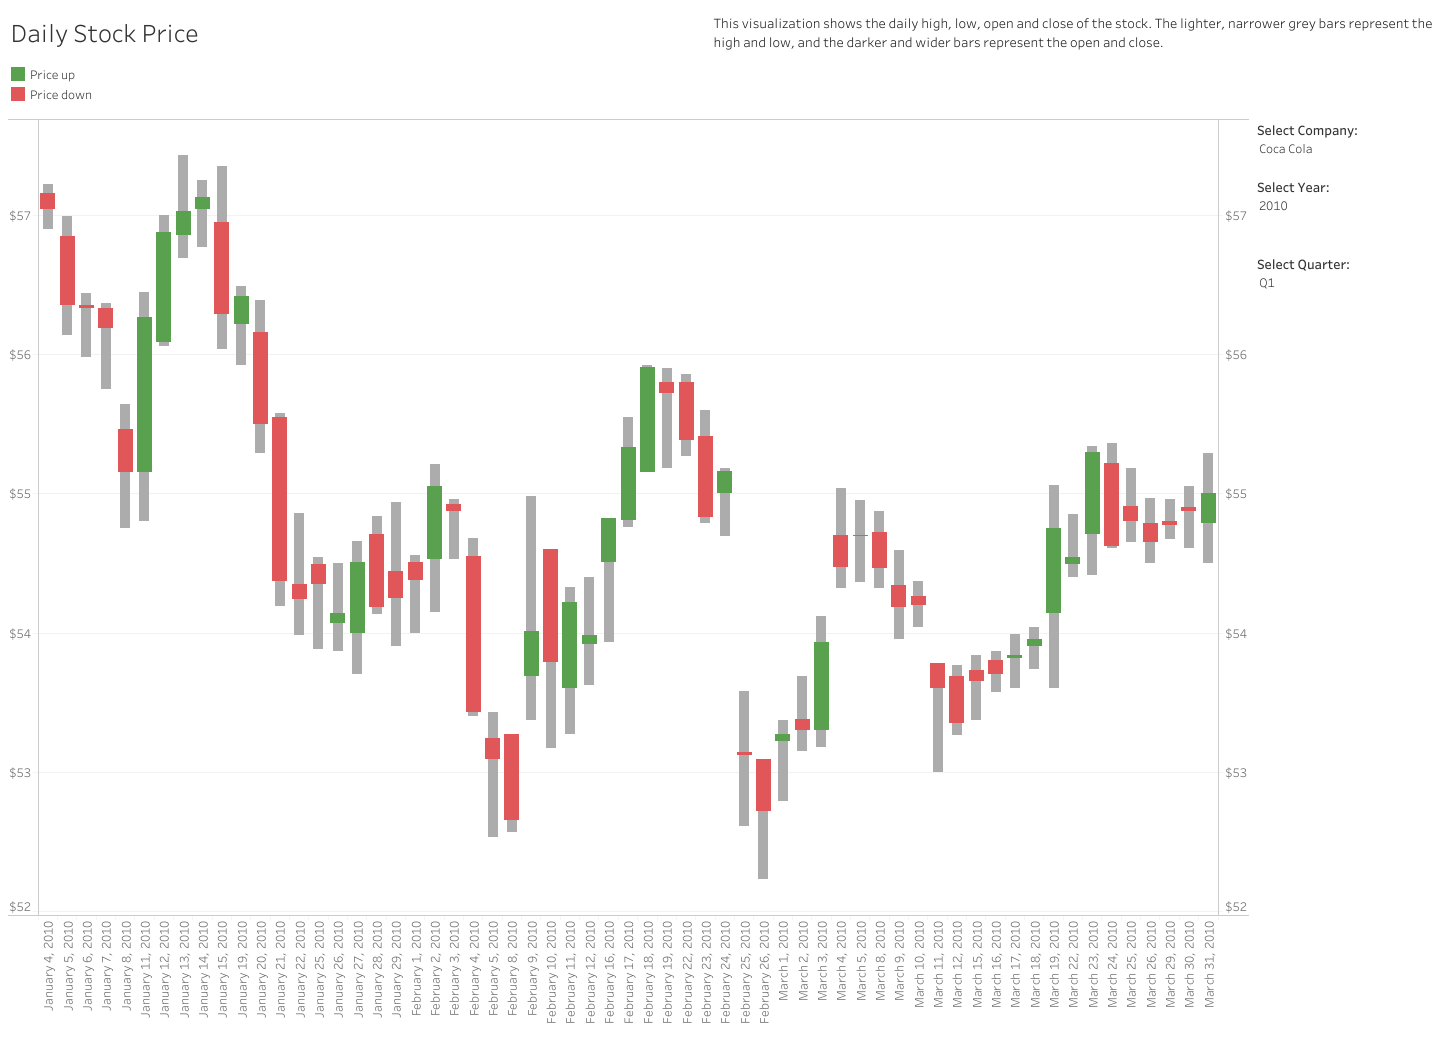
Stock Exchange Analysis Dashboard
This is one of the projects with a large amount of data and frequent data changes. The stock market generates a vast amount of data, allowing for further study. To indicate how the index has been moving and what highs and lows it has made, several combinations of area and trend charts can be used. Pie charts and bar charts may also be used to show volume. The problem statement is to evaluate a dataset of several equities and get useful information from it. This will assist others in making sound investing selections.
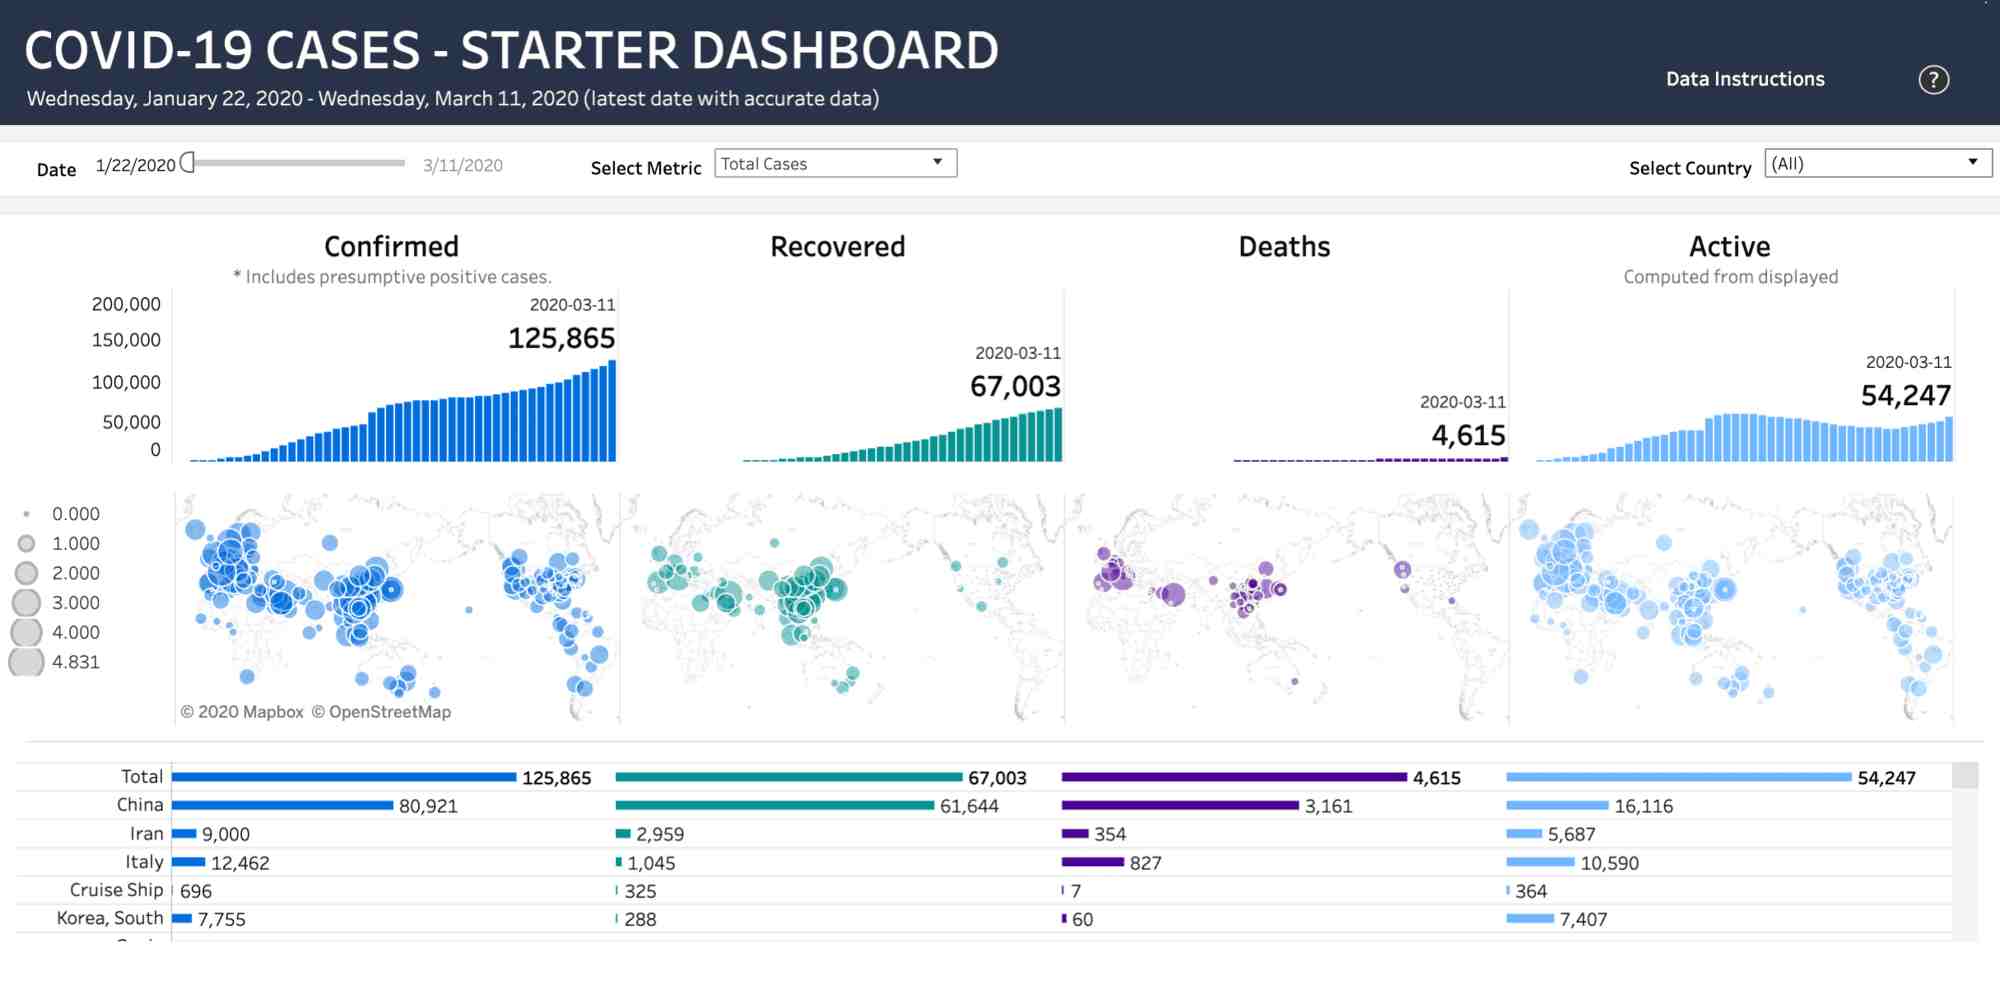
Covid-19 Analysis Dashboard
The Covid-19 epidemic has swept the whole planet into chaos. With so many cases throughout the world, the authorities found it really difficult to estimate the pandemic’s severity. However, using Tableau and analytics, many analysts were able to obtain government-verified data and utilise it to present the true global image. The goal is to examine a global collection of covid cases and provide real-time figures for various areas. Tableau may be used to visualize enormous volumes of data based on numerical or categorical data. You’ll be able to master your data visualisation abilities by working on a dashboard based on COVID-19 data with this assignment. You’ll make side-by-side bar graphs, employ parameters, and generate a dynamic mark label after connecting to real datasets. You’ll also make proportional maps and finish them off with a dashboard that brings everything together.
 Global Market Analysis
This project will introduce you to initiatives that are currently being executed by real-world firms. You will have demonstrated capacity to address business challenges by doing data analysis and delivering the best graphics available if you accomplish these tasks.
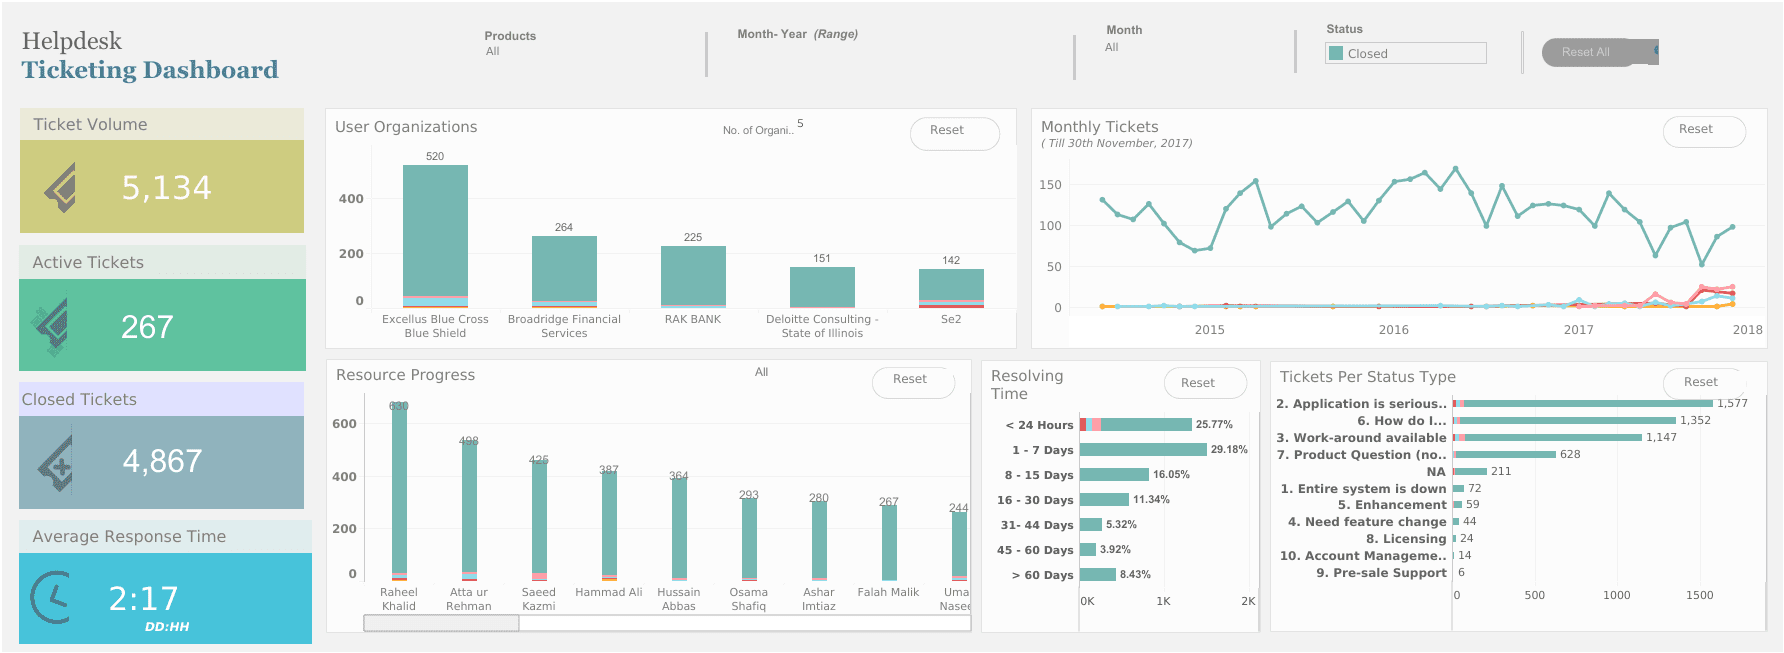
Helpdesk Ticketing Dashboard
Professionals may assess the key performance factors of ticketing to clients with this helpdesk ticketing dashboard. It has open and closed tickets, as well as response times and ticket statuses.
Tableau plays a critical role in customer service departments, as this example will demonstrate. It’s a great approach for bosses to check that their staff are working efficiently to reach their goals. They are able to quickly identify the problems they are having and act to enhance their overall job performance.
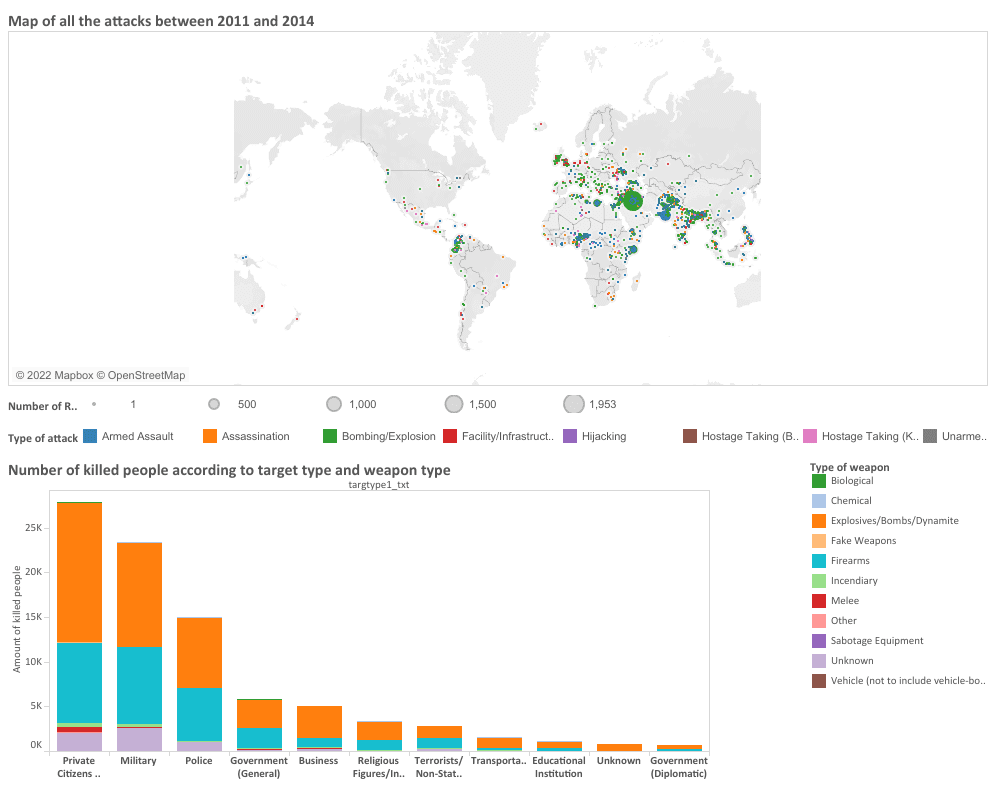
Global Terrorism Analysis Dashboard
This Tableau dashboard may be used to determine which regions of the world have the highest number of terrorist attacks. You may also undertake analysis using line graphs to observe the pattern of these assaults if the event dates are annually. Based on the Tableau analysis, predictions may be made to prevent future attacks.
The issue statement is to evaluate a global dataset on terrorism and then assist various world leaders in taking remedial measures to prevent attacks in the future.
 Advanced Projects:
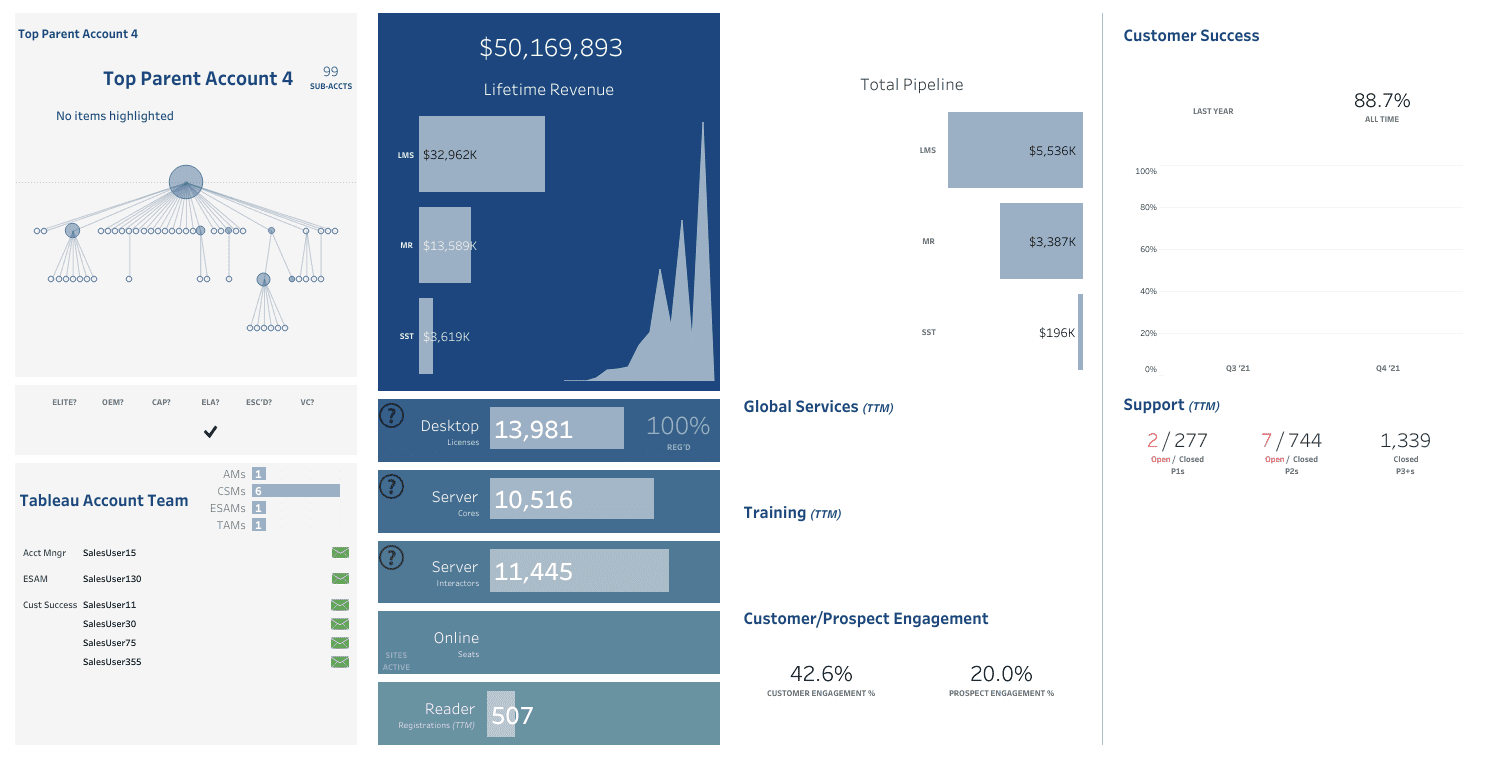
Account Management Dashboard
Any product-based business must have a clear view of where each of its accounts and clients sits. Sales analysts and managers will benefit from this pipeline dashboard. So when should you use it? When establishing sales targets, use this dashboard to get a sense of who representatives are selling to, how they’re selling (internal, field), what goods they’re selling, and where they’re selling.
To avoid blunders in the connection, salespeople want precise data on every engagement with an account. Has the customer lately received poor service? Is there a major transaction in the works that the seller is unaware of? To get a complete picture of your accounts, put all of your critical sales KPIs in one place. Understand how a firm is constructed, where your company has sold into an organization, and how much money a given customer has made in a short amount of time.
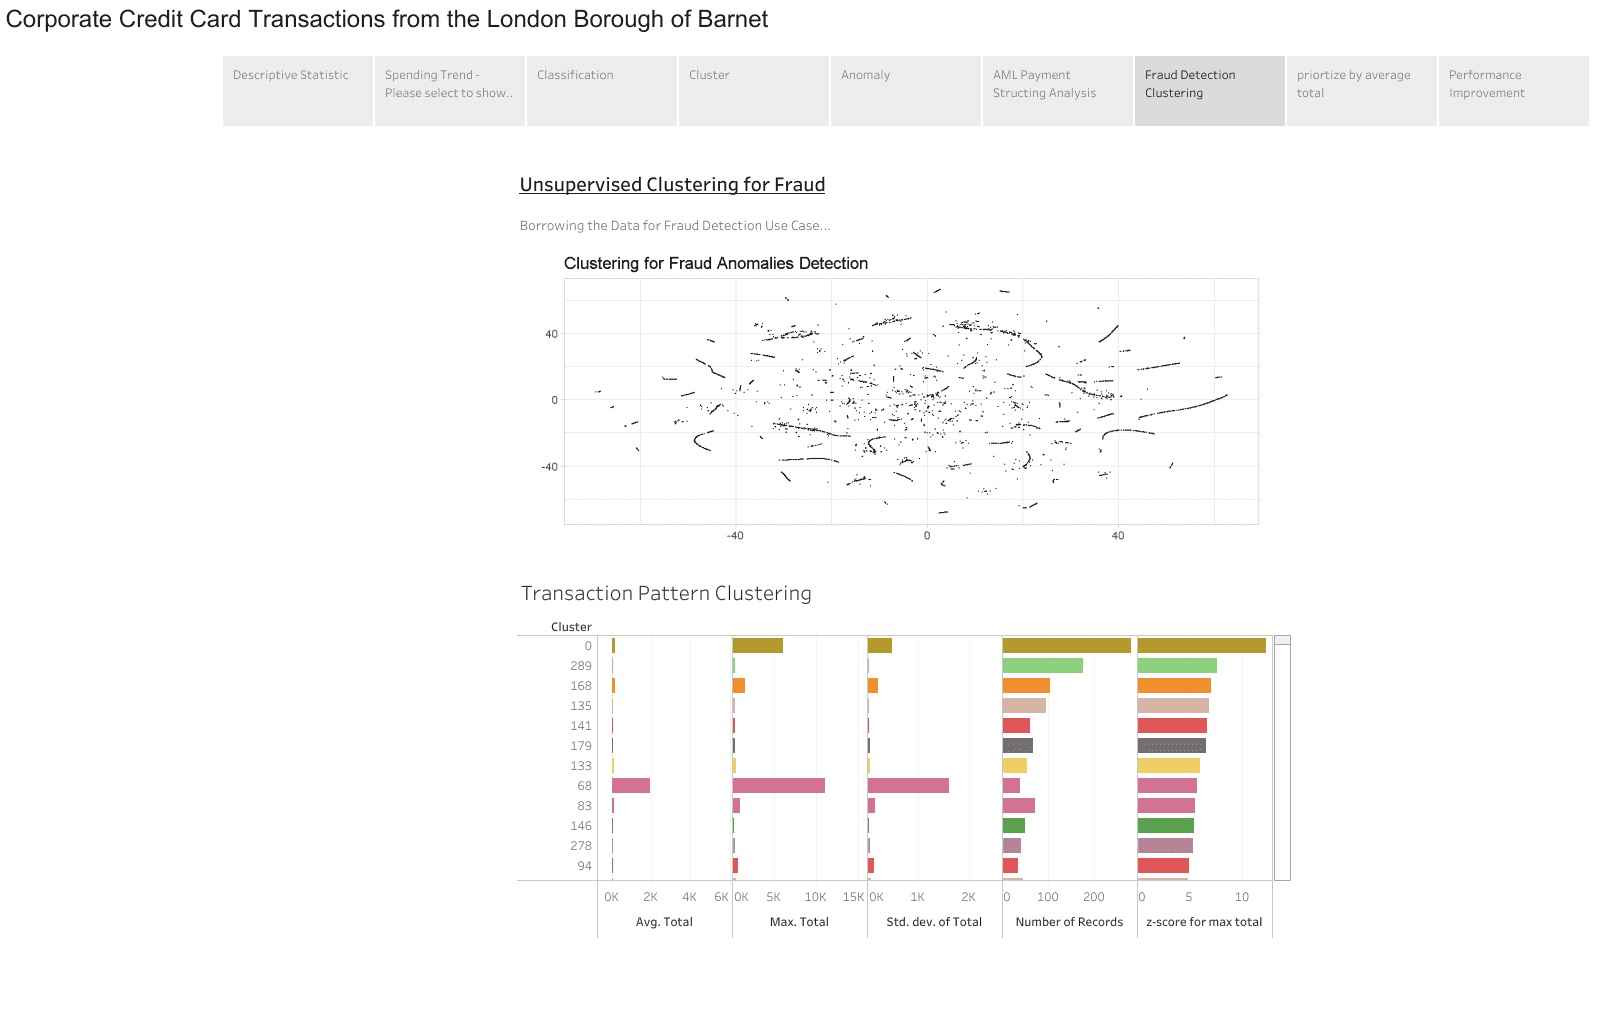
 Credit Card Fraud Detection Dashboard
Credit card fraud has risen in tandem with the rise of credit cards. With the provided dataset, one may conduct exploratory data analysis of various transactions in order to uncover any patterns. Tableau will be tremendously useful in visualizing such complicated transactions and identifying outliers using boxplots and other ways. The problem statement is to examine various credit card transactions and understand their patterns in order to discover abnormalities and fraudulent activities.
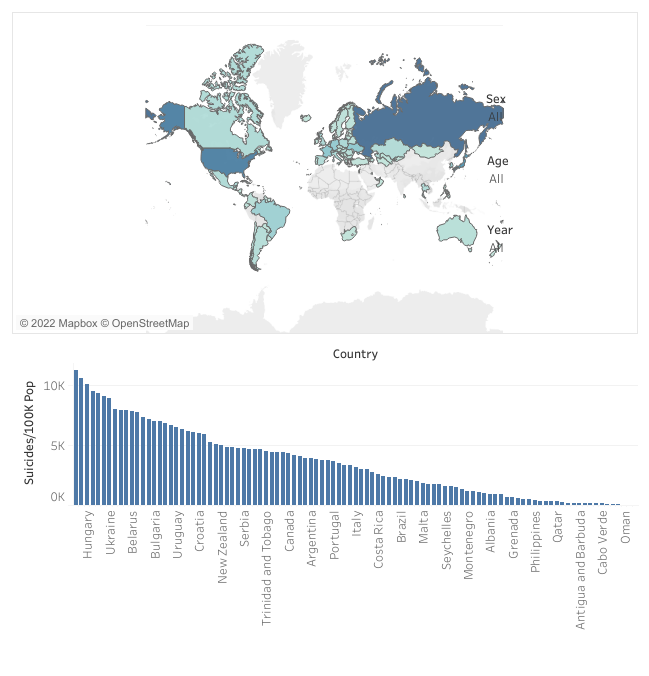
 Global Suicide Rates Detection Dashboard
The research study necessitates examining the frequency of suicide fatalities during a specific time period. Variables such as the Human Development Index, Gross Domestic Product, demography between certain years, and suicide rates should all be considered. You may use the statistics to show the rate of suicide or the reasons of suicide.
You may also add age, gender, or region to the project to make it more complicated. To demonstrate your advanced Tableau abilities, you must be willing to include a large number of variables in your project.
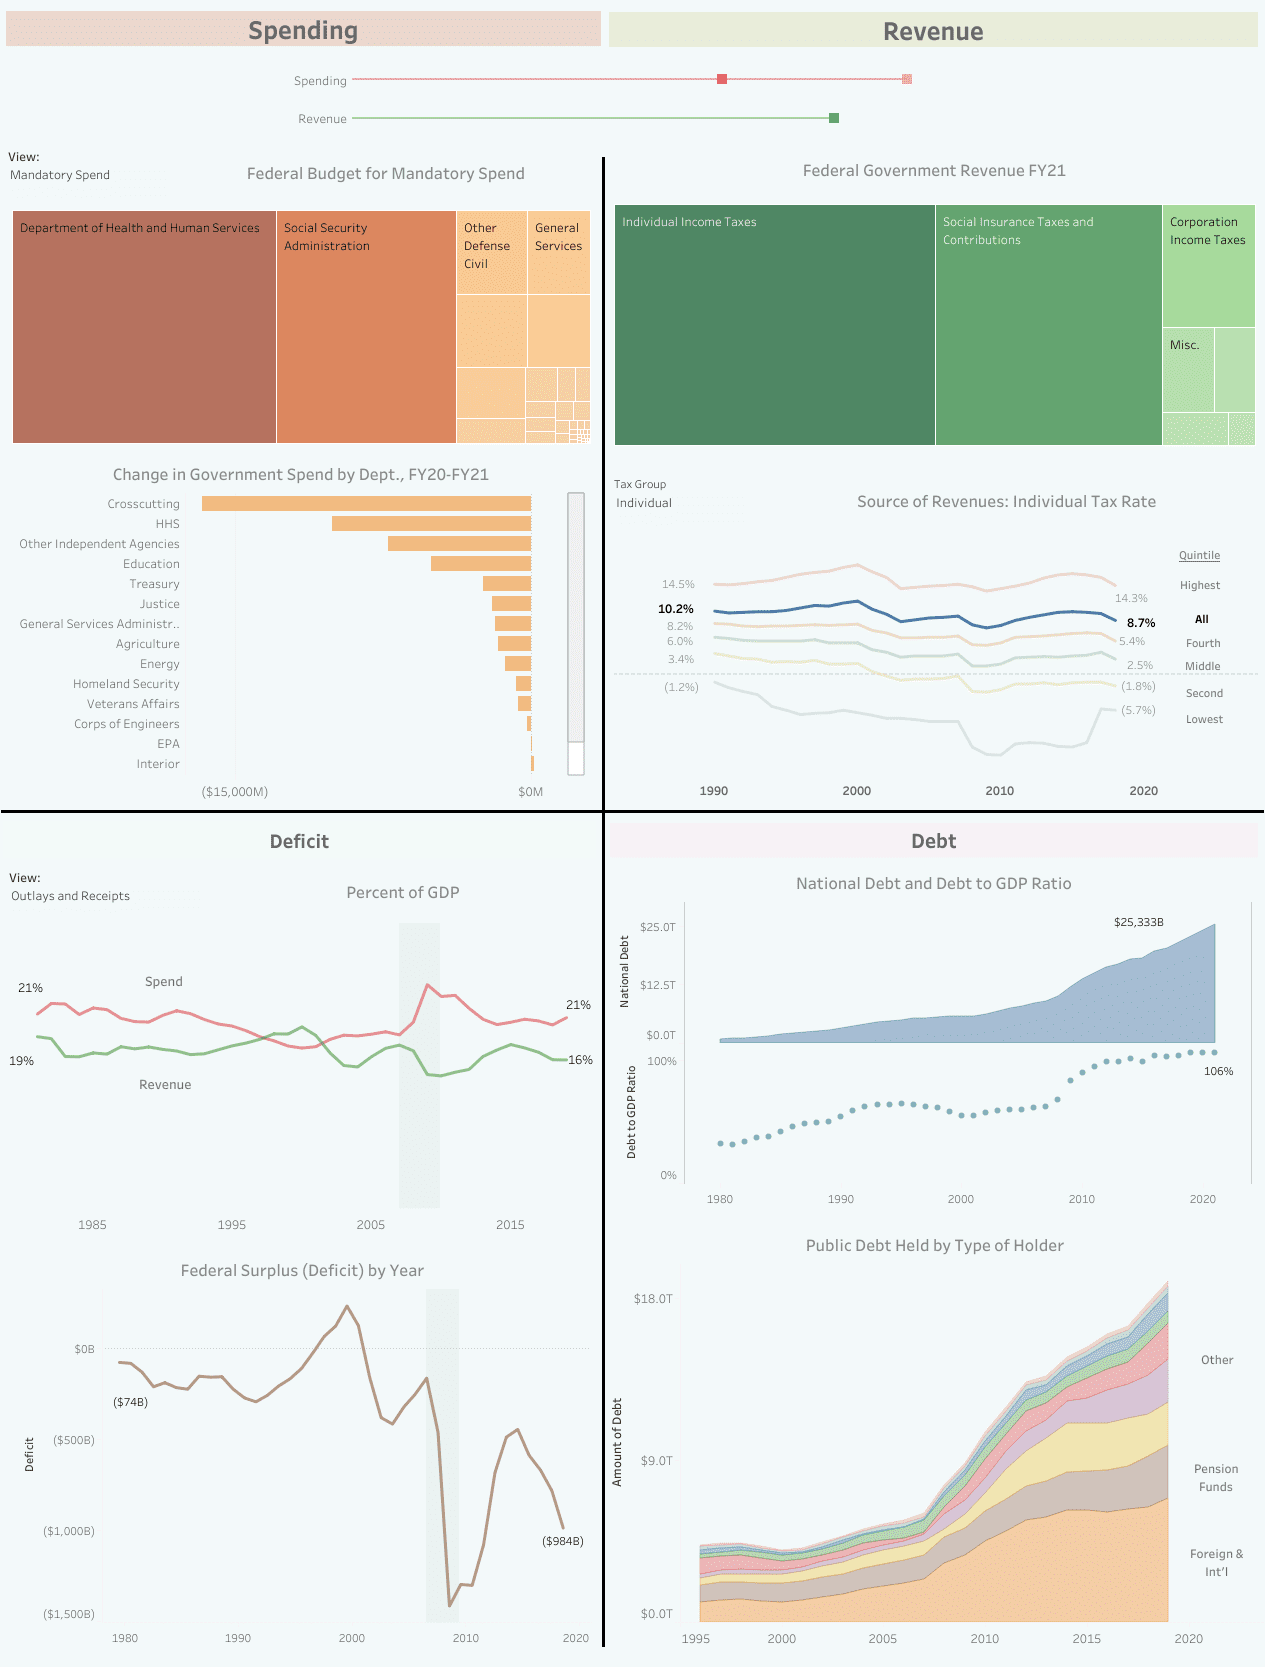
 Government Budget Dashboard
The money going in and out of a government is the subject of this customisable project. You have a lot of alternatives when it comes to different factors you may employ to make your final output more complete.
The better the project, the more intricate the data. It will demonstrate your superior data analysis and visualisation abilities. It will also solidify your knowledge of Tableau and assist you in landing a career in the IT business.
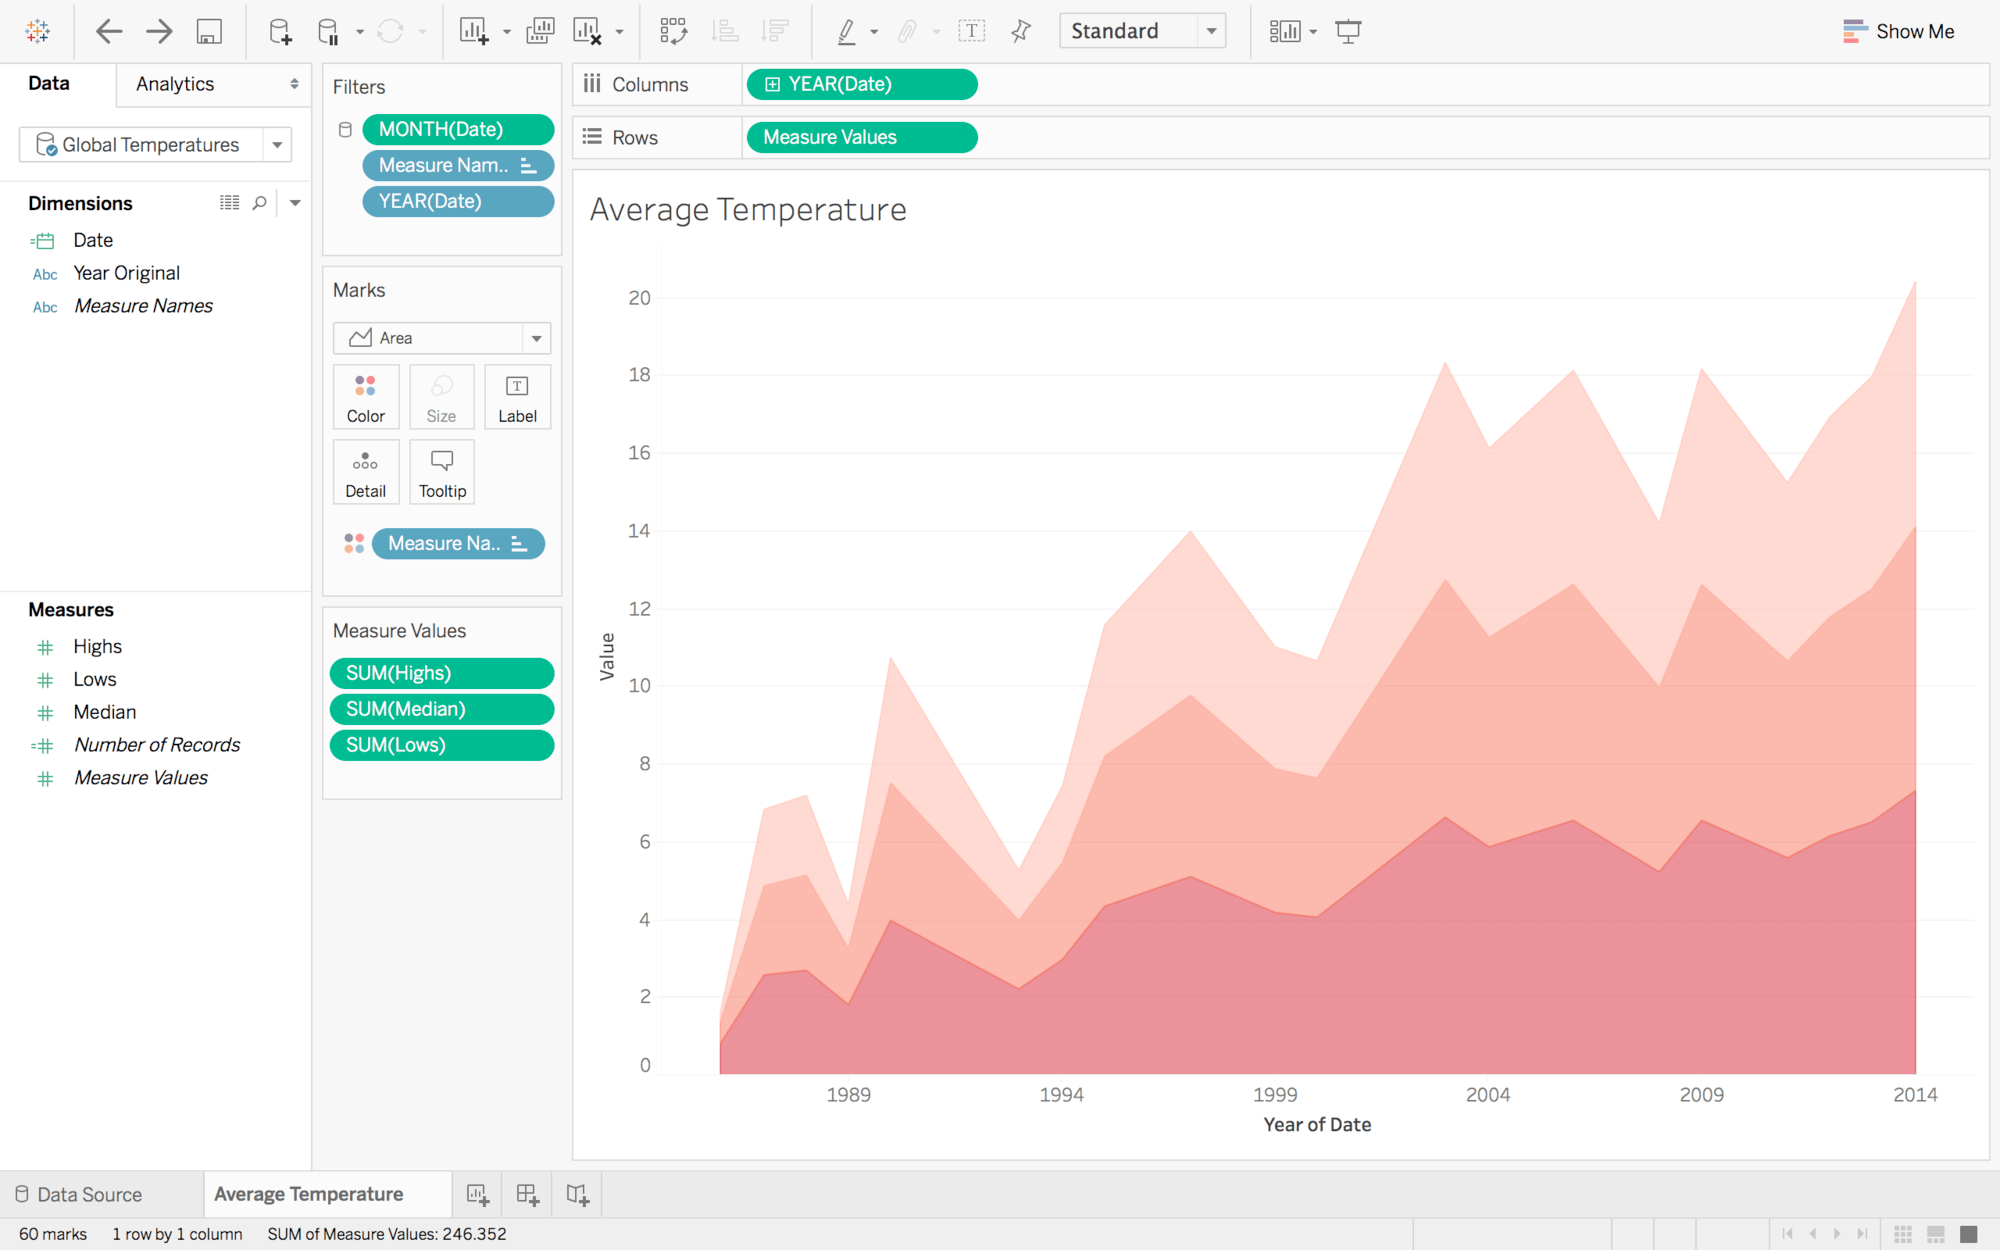
 Time Series Data Visualization Project Ideas
Working on a time-series data visualization project is another excellent way to gain knowledge of sophisticated technologies. The project entails displaying data using time series components. This data will be shown using Python, Tableau, R, and Excel. A stock market index is a fantastic example of a time series project.
What is Tableau’s primary goal?
Tableau is mostly used to visualise and comprehend data. Importing massive data sets, real-time data analysis, data visualisation, and business intelligence are some of Tableau’s other features. It may also be used to convert searches into visualisations.
What are the many Tableau types?
Tableau Desktop, Tableau Public, Tableau Online, Tableau Server, and Tableau Reader are the five main types of Tableau products. Tableau Server is a server programme that runs on both Windows and Linux. Tableau Public is a free programme that allows users to share their data visualisations with others. Tableau Online is a subscription-based server that comes with the Tableau programme.
For seeing analyses and underlying data, Tableau Reader is utilised. Tableau Mobile is a mobile app for iOS and Android that connects to the Tableau Server. Tableau’s solutions all help with exploratory data analysis.
What are Tableau’s primary features?
Tableau is a business intelligence solution with a dashboard, data source, security, in-memory data, and collaboration capabilities. These features work together to make it simple to organise, manage, and view data.
How can you get started with Tableau project management?
You may control and manage content access by taking ownership of a project. When a user starts a new project folder within another project, it inherits the parent project’s access rules, which are defined by the project owner.
The top-level project is exclusively under the control of the content administrator. Project owners have complete administrative control over top-level and nested projects, as well as the material they include. You must request access in project hierarchies to change the project leader’s access.
This blog should have given you a good idea of how to start making Projects on Tableau and what skills you can gain and examples of Tableau Projects. If you still want to learn more, do not worry, the Tableau Tutorial will help you better comprehend the tool. For that we have videos on YouTube which you can go through for better hands-on understanding of Tableau. If you’re interested in becoming Tableau certified, click the link below to learn more about Edureka’s Data Visualization Using Tableau Training and Certification. You may also obtain more free Edureka material by subscribing to our YouTube channel.
Got a question for us? Please mention it in the comments section and we will get back to you at the earliest.


 Thank you for registering Join Edureka Meetup community for 100+ Free Webinars each month JOIN MEETUP GROUP