
Advanced Power BI Certification Course with G ...
- 13k Enrolled Learners
- Weekend
- Live Class
(4230)


 Copy Link!
The aim of any BI tool is to give Data Analysis a better flow. If one, as a professional, faces the difficulty of using the tool while solving a problem, the state of flow is broken. One common cause of this problem is the need to work with data that has been aggregated to different Level Of Detail in Tableau (LOD).
There often are questions that one is bound to come across when analysing data. These questions are often simple to ask, but hard to answer. They often sound something like:
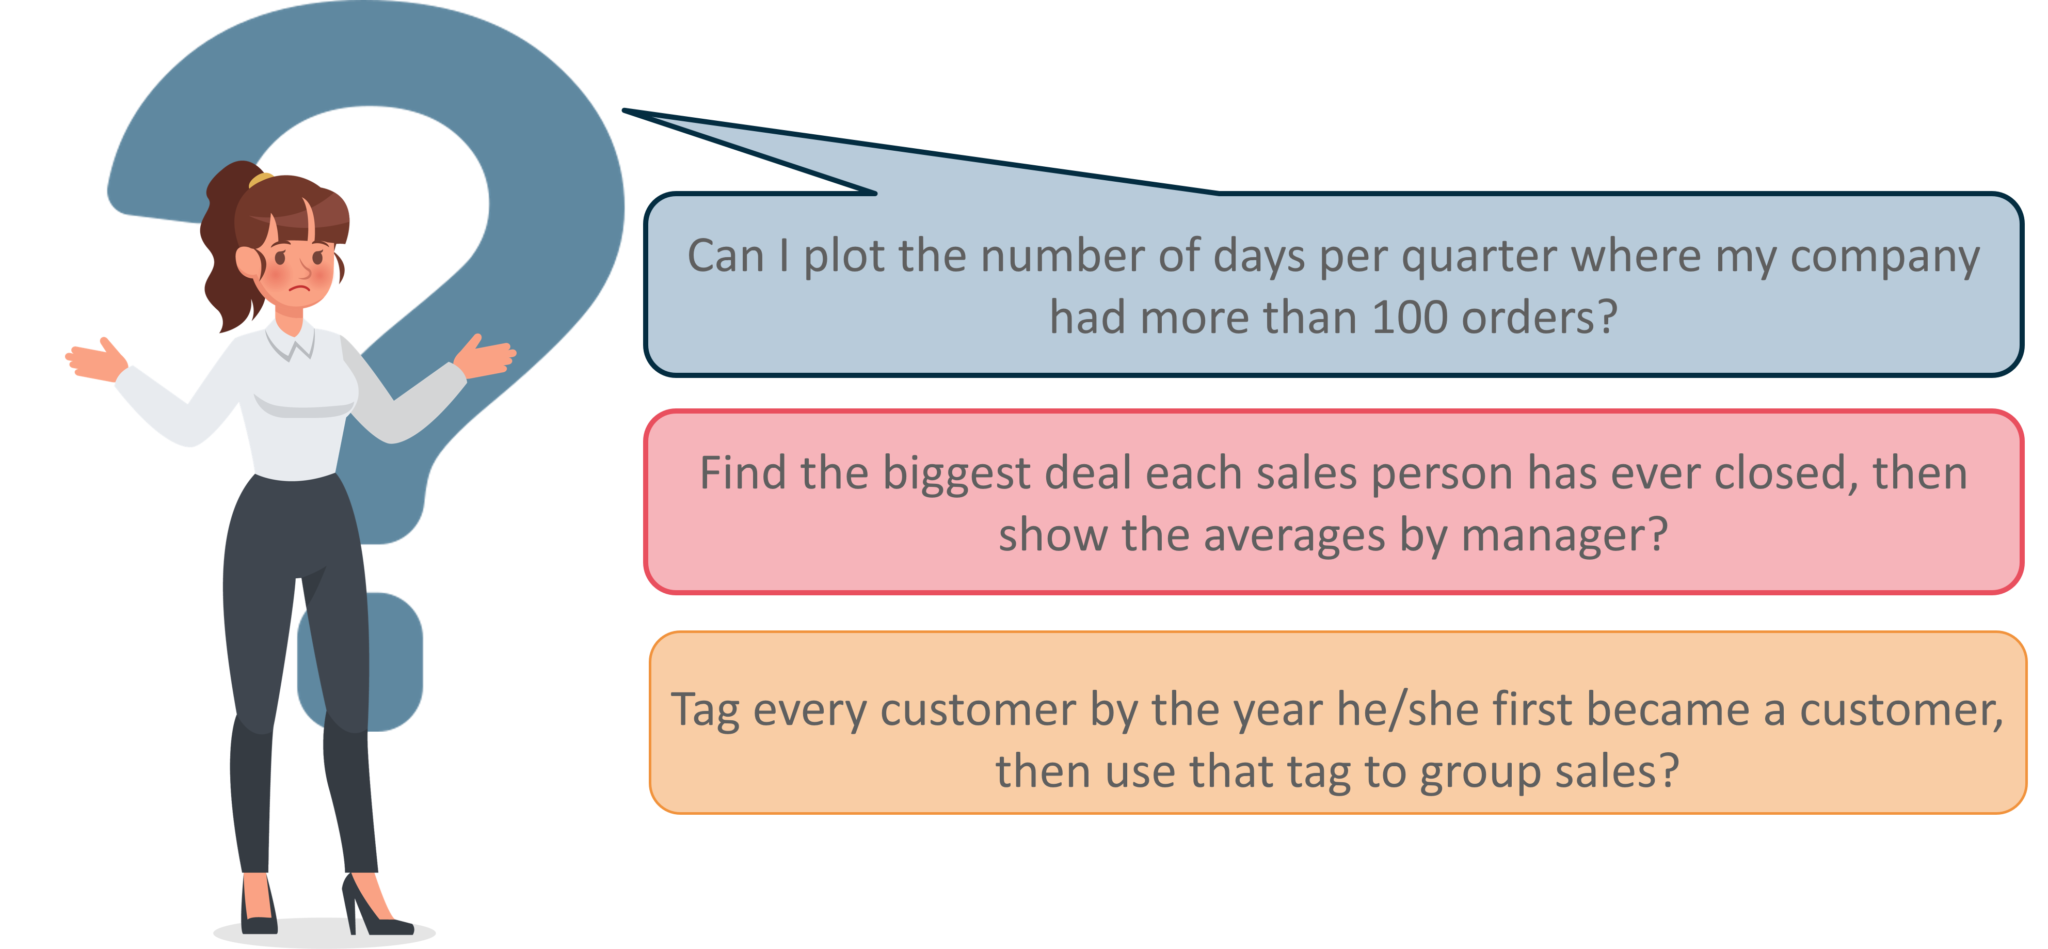 To address these types of questions, a new syntax was introduced called Level of Detail in Tableau 9.0. This new syntax both simplified and extended Tableau’s calculation language by making it possible to address these questions directly.

LOD Expressions represent an elegant and powerful way to answer questions involving multiple levels of granularity in a single visualization.
Level of Detail in Tableau or LOD expressions allow you to compute values at the data source level and the visualization level. However, LOD expressions give you even more control on the level of granularity you want to compute. They can be performed at a more granular level (INCLUDE Calculation), a less granular level (EXCLUDE Calculation), or an entirely independent level (FIXED Calculation).
In Tableau, expressions referencing unaggregated data source columns are computed for each row in the underlying table. In this case, the dimensionality of the expression is row level. An example of a row-level expression is:
[Sales] / [Profit]
This calculation will be evaluated in each row of the database. The Sales value in each row will be divided by the Profit value in that row, producing a new column with the result of the multiplication (a profit ratio).
If you create a calculation with this definition, save it with the name [ProfitRatio], and then drag it from the Data pane to a shelf, Tableau shall typically aggregate the calculated field for the view:
SUM[ProfitRatio]
By contrast, expressions referencing aggregated data source columns are computed at the dimensionality defined by the dimensions in the view. In this case, the dimensionality of the expression is view level. An example of a view-level expression is:
SUM(Sales) / SUM(Profit)
If you drag this calculation to a shelf (or type it directly on a shelf as an ad-hoc calculation), Tableau encloses it in an AGG function:
AGG(SUM(Sales) / SUM(Profit))
This is what is known as an Aggregate Calculation.
An expression has a coarser level of detail than the view when it references a subset of the dimensions in the view.
For example, for a view that contained the dimensions [Category] and [Segment], you could create a level of detail in Tableau that uses only one of these dimensions:
{FIXED [Segment] : SUM([Sales])}
In this case, the expression has a coarser level of detail than the view. It bases its values on one dimension ([Segment]), whereas the view is basing its view on two dimensions ([Segment] and [Category]).
The result is that using the level of detail expression in the view causes certain values to be replicated—that is, to appear multiple times.
An expression has a finer level of detail than the view when it references a superset of the dimensions in the view.
When you use such an expression in the view, Tableau will aggregate results up to the view level. For example, the following level of detail in Tableau references two dimensions:
{FIXED [Segment], [Category] : SUM([Sales])}
When this expression is used in a view that has only [Segment] as its level of detail, the values must be aggregated. Here’s what you would see if you dragged that expression to a shelf:
AVG([{FIXED [Segment]], [Category]] : SUM([Sales]])}])
An aggregation(in this case, average) is automatically assigned by Tableau. You can change the aggregation as needed.
Whether a Level Of Detail in Tableau expression is aggregated or replicated in the view is determined by the expression type and granularity.
Level of detail expressions are always automatically wrapped in aggregate when they are added to a shelf in the view unless they’re used as dimensions.
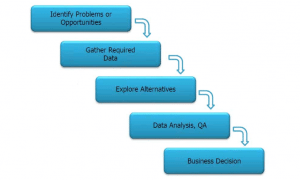
 The image here depicts the order of execution of filters from top to bottom. The text on the right shows where the LOD expressions are evaluated in this sequence.
Extract Filters (in orange) are only relevant if you’re creating a Tableau Extract from a data source. Table calculations filters (dark blue) are applied after calculations are executed and therefore hide marks without filtering out the underlying data used in the calculations.
FIXED calculations are applied before dimension filters, so unless you promote the fields on your Filter shelf to Improve View Performance with Context Filters, they will be ignored.
INCLUDE computes values using the specified dimensions in addition to whatever dimensions are in the view. This level of detail expression is most useful when including a dimension that isn’t in the view.
For Example: { INCLUDE [Customer Name] : SUM([Sales]) }
 EXCLUDE Calculation
EXCLUDE explicitly remove dimensions from the expression—that is, they subtract dimensions from the view level of detail. This level of detail in Tableau, is most useful for eliminating a dimension in the view.
For Example: {EXCLUDE [Region]: SUM([Sales])}
 FIXED Calculation
FIXED computes values using the specified dimensions without reference to the view level of detail—that is, without reference to any other dimensions in the view. This level of detail expression also ignores all the tableau filters in the view other than context filters, data source filters, and extract filters.
For Example: { FIXED [Region] : SUM([Sales]) }
A level of detail expression has the following structure:
{[FIXED | INCLUDE | EXCLUDE] <dimension declaration > : <aggregate expression>}
 Step 2: Create the LOD expression
Instead of the sum of all sales per region, perhaps you want to also see the average sales per customer for each region. You can use an LOD expression to do this.
{ INCLUDE [Customer Name] : SUM([Sales]) }

| Data Source | Supported/Not Supported |
| Actian Vectorwise | Not Supported. |
| Amazon EMR Hadoop Hive | Supported Hive 0.13 onwards. |
| Amazon Redshift | Supported. |
| Aster Database | Supported version 4.5 onwards. |
| Cloudera Hadoop | Supported Hive 0.13 onwards. |
| Cloudera Impala | Supported Impala 1.2.2 onwards. |
| Cubes (Multidimensional Data Sources) | Not Supported. |
| DataStax Enterprise | Not Supported. |
| EXASOL | Supported. |
| Firebird | Supported version 2.0 onwards. |
| Generic ODBC | Limited. Depends on Data Source. |
| Google Big Query | Supported for Standard SQL, not Legacy. |
| IBM DB2 | Supported version 8.1 onwards. |
| MarkLogic | Supported version 7.0 onwards. |
| SAP HANA | Supported. |
| SAP Sybase ASE | Supported. |
| SAP Sybase IQ | Supported version 15.1 onwards. |
| Spark SQL | Supported. |
| Splunk | Not Supported. |
| Tableau Data Extract | Supported. |
| Teradata | Supported. |
| Vertica | Supported version 6.1 onwards. |
| Microsoft Access | Not Supported. |
| Microsoft Jet-Based Connections | Not Supported. |
| Hortonworks Hadoop Hive | Supported Hive 0.13 onwards. On version 1.1 of HIVE, LOD expressions that produce cross-joins are not reliable. |
| IBM BigInsights | Supported. |
| Microsoft SQL Server | Supported SQL Server 2005 onwards. |
| MySQL | Supported. |
| IBM PDA (Netezza) | Supported version 7.0 onwards. |
| Oracle | Supported version 9i onwards. |
| Actian Matrix (ParAccel) | Supported version 3.1 onwards. |
| Pivotal Greenplum | Supported version 3.1 onwards. |
| PostgreSQL | Supported version 7.0 onwards. |
| Progress OpenEdge | Supported. |
LOD Expressions are not a new form of Table Calculations. Though they can replace many Table Calculations, their main aim is to open new possibilities. LOD Expressions and Table Calculations operate differently.
| Table Calculations | LOD Expressions |
| Table Calculations are generated by Query Results. | LOD Expressions are generated as a part of the Query to the underlying Data Source. They are expressed as a nested select, so, depending upon DBMS performance. |
| Table Calculations can only produce results either equal to or less granular than the said LOD. | LOD can produce results independent of said LOD. |
| Dimensions that control the operations of a table are separate from the calculation syntax. | Dimensions that control the operations of an LOD expression are embedded in the expression itself. |
| Table Calculations are used as aggregated measures. | LOD expressions can be used in other constructs. |
| Filters on Table Calculations act as a HIDE. | Filters on the LOD act as an EXCLUDE. |
The following are the constraints that apply for LOD expressions.
In addition, some data sources have complexity limits. Tableau will not disable calculations for these databases, but query errors are a possibility if calculations become too complex. Enhance your data security strategy and learn how to implement row-level security in tableau effectively with our in-depth guide.
This brings us to the end of this article on How do LOD Expressions work in Tableau?. If you wish to master Tableau, Edureka has a curated course on Tableau course which covers various concepts of data visualization in depth.


 Thank you for registering Join Edureka Meetup community for 100+ Free Webinars each month JOIN MEETUP GROUP