


Advanced Power BI Certification Course with G ...
- 13k Enrolled Learners
- Weekend/Weekday
- Live Class
(4230)


 Copy Link!
In a world that generates and consumes 2.5 quintillion bytes of data, a day, organizations are bound to look for new methods to transform and combine data in order to attain optimum efficiency. One such method of combining data is Data Blending in Tableau.
Now, because this serves such an important purpose in the data cycle of any given organization, it makes for a very essential module in most Tableau Training curriculum.
Suppose, you are a Tableau Developer who has transactional data stored in Salesforce and quota data stored in Access. The data you want to combine is stored in different databases, and the granularity of the data captured in each table is different in the two data sources, so data blending is the best way to combine this data.
Data blending is useful under the following conditions:
Cross-database joins do not support connections to cubes (for example, Oracle Essbase) or to some extract-only connections (for example, Google Analytics). In this case, set up individual data sources for the data you want to analyze, and then use data blending to combine the data sources on a single sheet.
Sometimes one data set captures data using various levels of detail i.e, greater or lesser granularity than the other data set.
For example, suppose you are analyzing transactional data and quota data. Transactional data might capture all transactions. However, quota data might aggregate transactions at the quarter level. Because the transactional values are captured at different levels of detail in each data set, you should use data blending to combine the data.
Data Blending is a very powerful feature in Tableau. It is used when there is related data in multiple data sources, which you want to analyze together in a single view. It is a method for combining data that supplements a table of data from one data source with columns of data from another data source.
Usually, you use joins to perform this kind of data combining, but there are times, depending on factors like the type of data and its granularity, when it’s better to use data blending.
Data blending simulates a traditional left join. The main difference between the two is when the join is performed with respect to aggregation.
When you use a left join to combine data, a query is sent to the database where the join is performed. Using a left join returns all rows from the left table and any rows from the right table that has a corresponding row match in the left table. The results of the join are then sent back to and aggregated by Tableau.
For example, suppose you have the following tables. If the common columns are User ID, a left join takes all the data from the left table, as well as all the data from the right table because each row has a corresponding row match in the left table.
 Data Blending
When you use data blending to combine data, a query is sent to the database for each data source that is used on the sheet. The results of the queries, including the aggregated data, are sent back and combined by Tableau. The view uses all rows from the primary data source, the left table, and the aggregated rows from the secondary data source, the right table, based on the dimension of the linking fields.
You can change the linking field or add more linking fields to include different or additional rows of data from the secondary data source in the blend, changing the aggregated values.
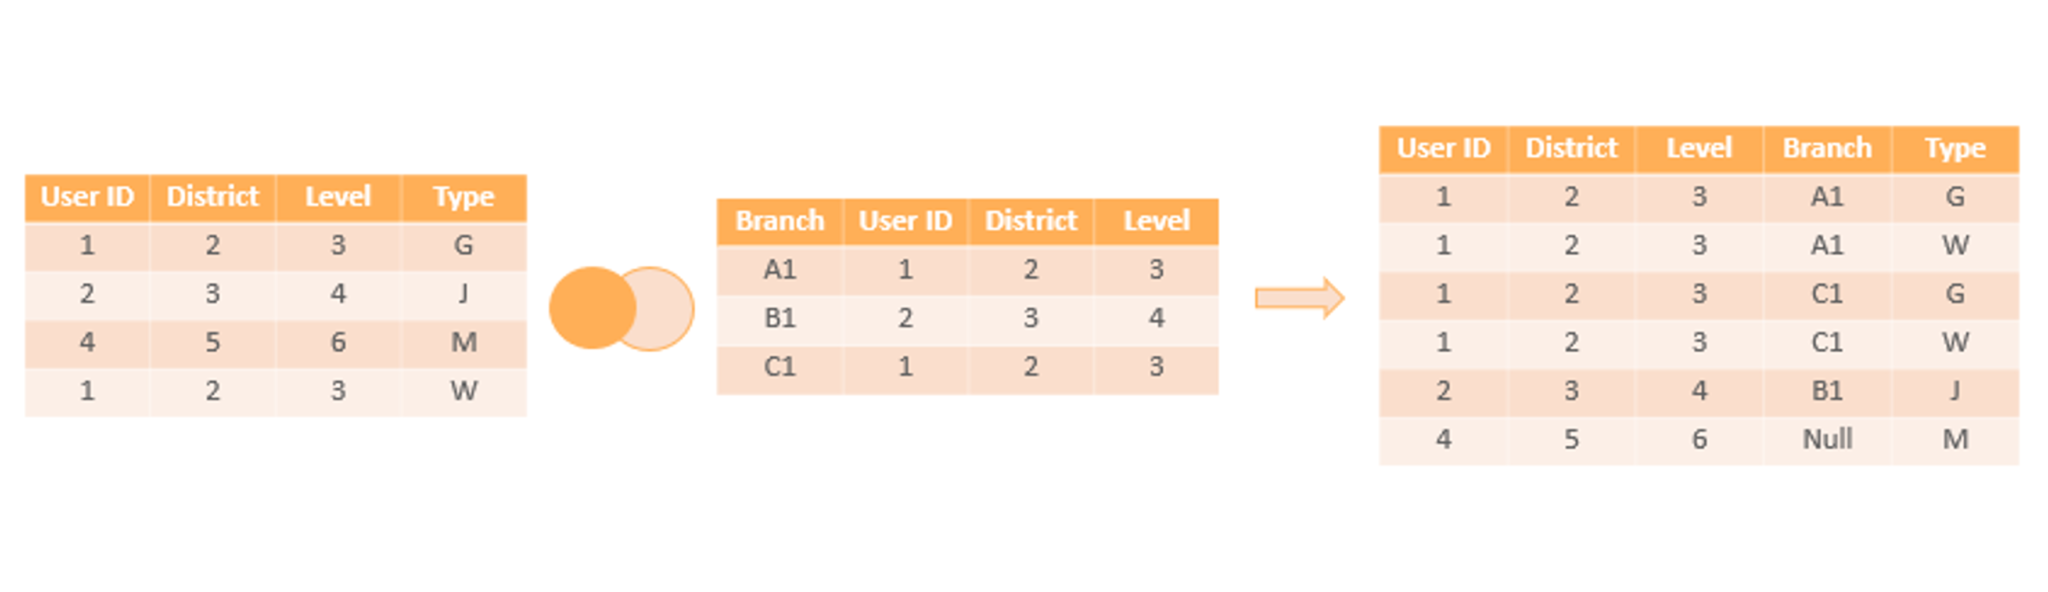
For example, suppose you have the following tables. If the linking fields are User ID in both the tables blending your data takes all of the data from the left table, and supplements the left table with the data from the right table. In this case, not all values can be a part of the resulting table because of the following:
 Suppose you have the same tables as above, but the secondary data source contains a new field called Fines. Again, if the linking field is User ID, blending your data takes all of the data from the left table, and supplements it with data from the right table. In this case, you see the same null value and asterisks in the previous example in addition to the following:
 When to Substitute Joining for Blending
If your tables do not match up with each other correctly after a join, set up data sources for each table, make any necessary customizations (that is, rename columns, change column data types, create groups, use calculations, etc.), and then use data blending to combine the data.
Duplicate data after a join is a symptom of data at different levels of detail. If you notice duplicate data, instead of creating a join, use data blending to blend on a common dimension instead.
Typically joins are recommended for combining data from the same database. Joins are handled by the database, which allows joins to leverage some of the database’s native capabilities. However, if you’re working with large sets of data, joins can put a strain on the database and significantly affect performance. In this case, data blending might help. Because Tableau handles combining the data after the data is aggregated, there are fewer data to combine. When there are fewer data to combine, generally, performance improves.
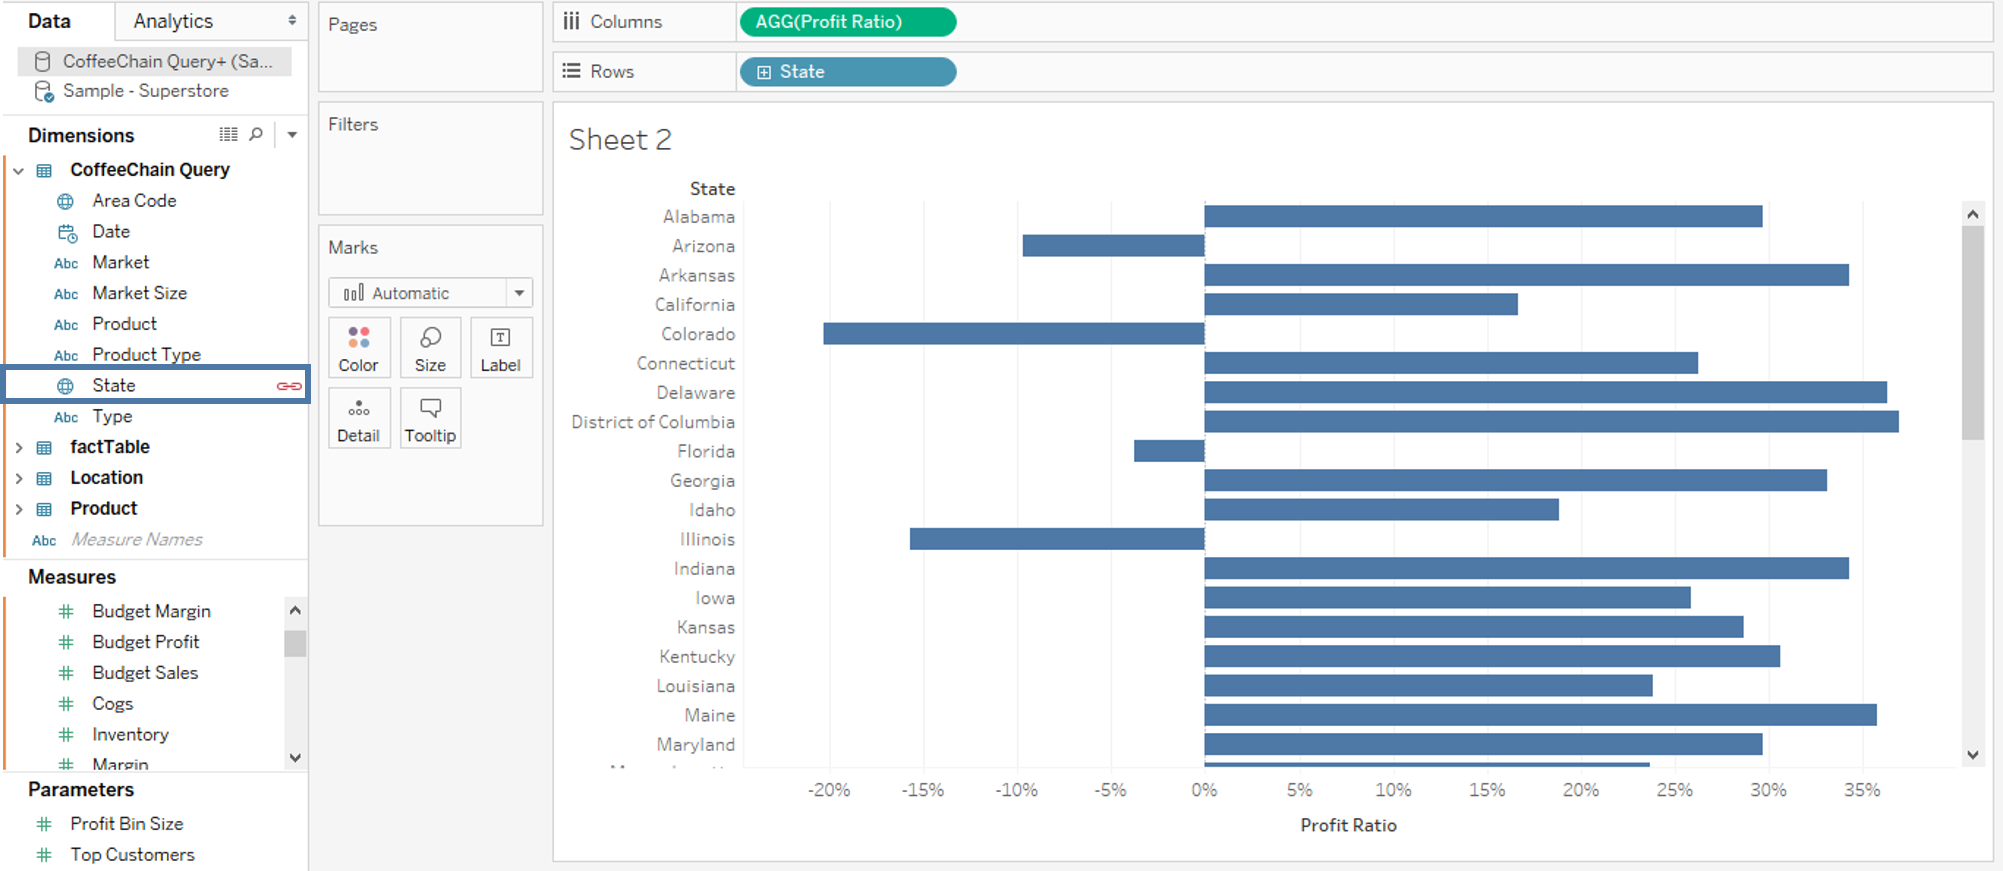
You can use data blending when you have data in separate data sources that you want to analyze together on a single sheet. Tableau has two inbuilt data sources named Sample-superstore and Sample coffee chain.mdb which will be used to illustrate data blending.
Step 1: Connect to your data and set up the data sources
Step 2: Designate a primary data source

Step 3: Designate a secondary data source
Step 4: Blend Data
 Limitations of Data Blending in Tableau
I hope you all, now, have a fair idea about Data Blending in Tableau from this blog. Hungry for more knowledge? Don’t worry, this video will give you a better understanding of the concept.


 Thank you for registering Join Edureka Meetup community for 100+ Free Webinars each month JOIN MEETUP GROUP