


Data Science and Machine Learning Internship ...
- 22k Enrolled Learners
- Weekend/Weekday
- Live Class
(8500)
With the exponential growth in AI, Machine Learning is becoming one of the most sort after fields. As the name suggests, Machine Learning is the ability to make machines learn through data by using various Machine Learning Algorithms and in this blog on Support Vector Machine In R, we’ll discuss how the SVM algorithm works, the various features of SVM and how it used in the real world.
To get in-depth knowledge on Data Science and the various Machine Learning Algorithms, you can enroll for live Data Science with Python Certification Training by Edureka with 24/7 support and lifetime access.
Before we move any further, let me list down the topics I’ll be covering:
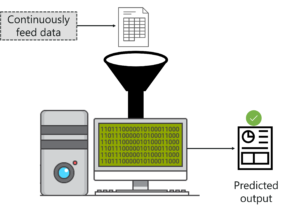
Machine learning is a science of getting computers to act by feeding them data and letting them learn a few tricks on their own, without being explicitly programmed to do so
The key to machine learning is the data. Machines learn just like us humans. We humans need to collect information and data to learn, similarly, machines must also be fed data in order to learn and make decisions.
Introduction to machine learning – Support Vector Machine In R
To understand Machine learning, let’s consider an example. Let’s say you want a machine to predict the value of a stock. In such situations, you just feed the machine with relevant data. After that, you must create a model which is used to predict the value of the stock.
One thing to keep in mind is, the more data you feed the machine, the better it’ll learn and make more accurate predictions.
Obviously, ML is not so simple. For a machine to analyze and get useful insights from data, it must process and study the data by running different algorithms on it. And in this blog, we’ll be discussing one of the most widely used algorithms called SVM.
So, that was a brief introduction to Machine Learning, if you want to learn more about Machine Learning, check out this video by our experts:
This Edureka video on “What is Machine Learning” gives an introduction to Machine Learning and its various types.
Now that you have a brief idea about Machine learning, let’s look at the different ways in which machines learn.
Supervised means to oversee or direct a certain activity and make sure it’s done correctly. In this type of learning the machine learns under guidance.
At school, our teachers guided us and taught us, similarly in supervised learning, you feed the model a set of data called training data, which contains both input data and the corresponding expected output. The training data acts as a teacher and teaches the model the correct output for a particular input so that it can make accurate decisions when later presented with new data.
Unsupervised means to act without anyone’s supervision or direction.
In unsupervised learning, the model is given a data set which is neither labeled nor classified. The model explores the data and draws inferences from data sets to define hidden structures from unlabeled data.
An example of unsupervised learning is an adult like you and me. We don’t need a guide to help us with our daily activities, we figure things out on our own without any supervision.

Types of machine learning – Support Vector Machine In R
Reinforcement means to establish or encourage a pattern of behavior. Let’s say you were dropped off at an isolated island, what would you do?
Initially, you’d panic and be unsure of what to do, where to get food from, how to live and so on. But after a while you will have to adapt, you must learn how to live in the island, adapt to the changing climates, learn what to eat and what not to eat.
You’re following what is known as the hit and trail concept because you’re new to this surrounding and the only way to learn, is experience and then learn from your experience.
This is what reinforcement learning is. It is a learning method wherein an agent (you, stuck on an island) interacts with its environment (island) by producing actions and discovers errors or rewards.
If you want to get an in-depth explanation about Support Vector Machine, check out this video recorded by our Machine Learning experts.
This session is dedicated to how SVM works, the various features of SVM and how it used in the real world.
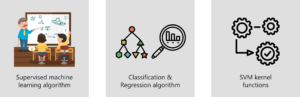
SVM (Support Vector Machine) is a supervised machine learning algorithm which is mainly used to classify data into different classes. Unlike most algorithms, SVM makes use of a hyperplane which acts like a decision boundary between the various classes.
SVM can be used to generate multiple separating hyperplanes such that the data is divided into segments and each segment contains only one kind of data.
What is SVM? – Support Vector Machine In R
Before moving further, let’s discuss the features of SVM:
In order to understand how SVM works let’s consider a scenario.
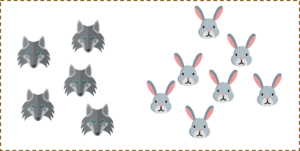
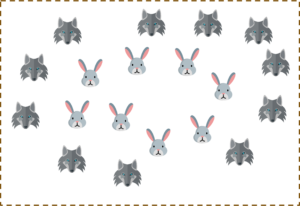
For a second, pretend you own a farm and you have a problem–you need to set up a fence to protect your rabbits from a pack of wolves. But where do you build your fence?
How does SVM work? – Support Vector Machine In R
One way to get around the problem is to build a classifier based on the position of the rabbits and wolves in your pasture.
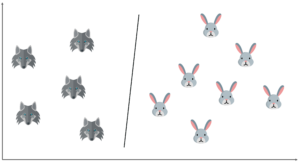
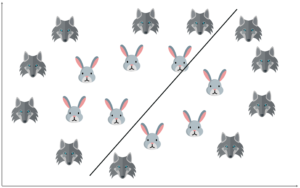
So if I do that, and try to draw a decision boundary between the rabbits and the wolves, it looks something like this. Now you can clearly build a fence along this line.
How does SVM work? – Support Vector Machine In R
In simple terms, this is exactly how SVM works. It draws a decision boundary, i.e. a hyperplane between any two classes in order to separate them or classify them.
Now I know you’re thinking how do you know where to draw a hyperplane?
The basic principle behind SVM is to draw a hyperplane that best separates the 2 classes. In our case the two classes are the rabbits and the wolves. Before we move any further, let’s try to understand what a support vector is.
So, you start of by drawing a random hyperplane and then you check the distance between the hyperplane and the closest data points from each class. These closest data points to the hyperplane are known as support vectors. And that’s where the name comes from, support vector machine.
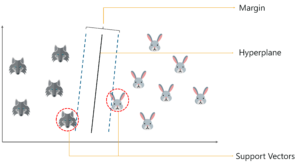
How does SVM work? – Support Vector Machine In R
The hyperplane is drawn based on these support vectors and an optimum hyperplane will have a maximum distance from each of the support vectors. And this distance between the hyperplane and the support vectors is known as the margin.
To sum it up, SVM is used to classify data by using a hyperplane, such that the distance between the hyperplane and the support vectors is maximum.
Alright, now let’s try to solve a problem.
Let’s say that I input a new data point and now I want to draw a hyperplane such that it best separates these two classes.
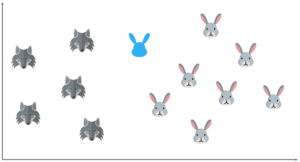
How does SVM work? – Support Vector Machine In R
So, I start off by drawing a hyperplane and then I check the distance between the hyperplane and the support vectors. Here I’m basically trying to check if the margin is maximum for this hyperplane.
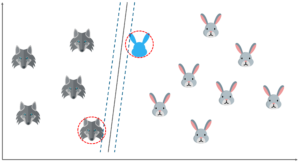
How does SVM work? – Support Vector Machine In R
But what if I draw the hyperplane like this? The margin for this hyperplane is clearly more than the previous one. So, this is my optimal hyperplane.
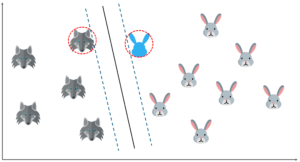
How does SVM work? – Support Vector Machine In R
So far it was quite easy, our data was linearly separable, which means that you could a draw a straight line to separate the two classes!
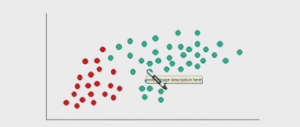
But what will you do if the data set is like this?
How does SVM work? – Support Vector Machine In R
You possibly can’t draw a hyperplane like this! It doesn’t separate the two classes.
How does SVM work? – Support Vector Machine In R
This is where Non-linear SVM is implemented.
Earlier in this blog, I mentioned how a kernel can be used to transform data into another dimension that has a clear dividing margin between classes of data.
Kernel functions offer the user the option of transforming nonlinear spaces into linear ones.
Until this point, we were plotting our data on 2-dimensional space. So, we had only 2 variables, x and y.
A simple trick would be transforming the two variables x and y into a new feature space involving a new variable z. Basically, we’re visualizing the data on a 3-dimensional space.
When you transform the 2D space into a 3D space you can clearly see a dividing margin between the 2 classes of data. And now you can go ahead and separate the two classes by drawing the best hyperplane between them.
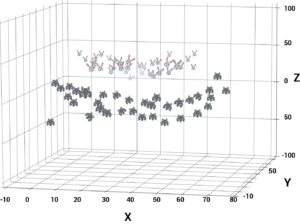
Non-linear Support Vector Machine – Support Vector Machine In R
This sums up the idea behind Non-linear SVM. To understand the real world applications of Support Vector Machine let’s look at a use case.
SVM as a classifier has been used in cancer classification since the early 2000’s.
A group of professionals held an experiment to classify colon cancer tissue by using SVM. The dataset consisted of about 2000 transmembrane protein samples and only about 50-200 gene samples were input into the SVM classifier. The sample input to the SVM had both colon cancer tissue samples and normal colon tissues.
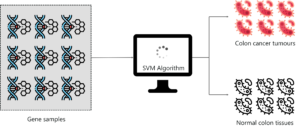
SVM Use Case – Support Vector Machine In R
The main objective of this study was to classify gene samples based on whether they are cancerous or not. So SVM was trained using the 50-200 samples in order to discriminate non-tumor from tumor specimens. The performance of the SVM classifier was very accurate for even a small data set and its performance was compared to other classification algorithms like Naïve Bayes and in each case, the SVM outperformed Naive Bayes.
So after this experiment, it was clear that SVM classified the data more effectively and it worked exceptionally good with small data sets.
Alright, now let’s get into the practical part. We’ll run a demo to better understand how SVM can be used as a classifier.
A lot of people have this question mind,
The answer is, R is basically an open source statistical, programming language used mainly in the field of Data Science. In our demo, we’ll be using the R programming language to build a SVM classifier, so if you don’t have a good understanding of R, I suggest you watch this video recorded by our experts:
This Edureka R Programming Tutorial For Beginners will help you in understanding the fundamentals of R and will help you build a strong foundation in R.
You can also refer this R for Data Science blog to learn more about how the entire Data Science workflow can be implemented using R.
To Study a heart disease data set and to model a classifier for predicting whether a patient is suffering from any heart disease or not.
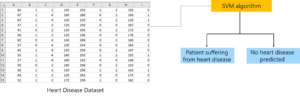
SVM Demo Problem statement – Support Vector Machine In R
In this demo, we’ll be using the Caret package. The caret package is also known as the Classification And REgression Training, has tons of functions that helps to build predictive models. It contains tools for data splitting, pre-processing, feature selection, tuning, unsupervised learning algorithms, etc.
So, to use it, we first need to install it using this command:
install.packages(“caret”)
The caret package is very helpful because it provides us direct access to various functions for training our model with various machine learning algorithms like KNN, SVM, decision tree, linear regression, etc.
After installing it, we just need to load the package into our console, to do that we have this code:
library('caret')
Our next step is to load the data set.
For this demo, we’ll be using a Heart Disease data set which consists of various attributes like the person’s age, sex, cholesterol level and etc. In the same data set, we’ll have a target variable, which is used to predict whether a patient is suffering from any heart disease or not
In short, we’ll be using SVM to classify whether a person is going to be prone to heart disease or not.
The data set looks like this:
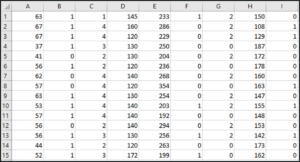
Heart Data set – Support Vector Machine In R
This data set has around 14 attributes and the last attribute is the target variable which we’ll be predicting using our SVM model.
Now it’s time to load the data set:
heart <- read.csv("/Users/zulaikha/Desktop/heart_dataset.csv", sep = ',', header = FALSE)
In the above line of code, we’re reading the dataset which is stored in a CSV format and that’s why we’ve used the read.csv function to read it from the specified path.
The ‘sep’ attribute indicates that the data is stored in a CSV or Comma Separated Version.
Now that we’ve imported our dataset, let’s check the structure of our dataset:
For checking the structure of data frame we can call the function str():
str(heart)
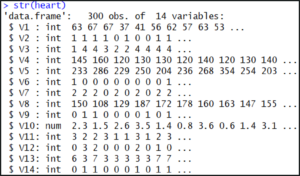
Structure of Data set – Support Vector Machine In R
The output shows us that our dataset consists of 300 observations each with 14 attributes.
If you want to display the top 5-6 rows of the data set, use the head() function:
head(heart)
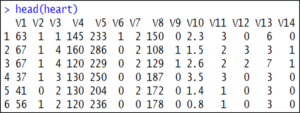
Head of Data set – Support Vector Machine In R
Our next step is to split the data into training set and testing set, this is also called data splicing.
We’ll be using the training set specifically for our model building and the testing set for evaluating the model:
intrain <- createDataPartition(y = heart$V14, p= 0.7, list = FALSE)
training <- heart[intrain,]
testing <- heart[-intrain,]
The caret package provides a method createDataPartition() which is basically for partitioning our data into train and test set.
We’ve passed 3 parameters to this createdatapartition() function:
Now this createDataPartition() method is returning a matrix “intrain”. This intrain matrix has our training data set and we’re storing this in the ‘training’ variable and the rest of the data, i.e. the remaining 30% of the data is stored in the testing variable.
Next, for checking the dimensions of our training data frame and testing data frame, we can use these:
dim(training);
dim(testing);
Our next step is to clean the data, so if there are any missing values or inconsistent values, they have to be dealt with before we build the training model
We’ll be using the anyNA() method, which checks for any null values:
anyNA(heart)
on running this, we get the return values as false, which means that there are no missing values in our dataset.
Next, we’re checking the summary of our data by using the summary() function
summary(heart)
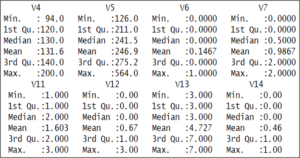
Summary Data set – Support Vector Machine In R
The output shows that the values of the various variables are not standardized.
For example, the V14 variables, which is our target variable, it holds only 2 values, either 0 or 1.
Instead, this should be a categorical variable. To convert these to categorical variables, we need to factorize them:
training[["V14"]] = factor(training[["V14"]])
The above code will convert the training data frame’s “V14” column to a factor variable.
Our next step is to train our model.
Before we train our model, we’ll first implement the trainControl() method. This will control all the computational overheads so that we can use the train() function provided by the caret package. The training method will train our data on different algorithms.
First, let’s focus on the traincontrol() method:
trctrl <- trainControl(method = "repeatedcv", number = 10, repeats = 3)
The trainControl() method here, is taking 3 parameters.
This trainControl() method returns a list. We are going to pass this on our train() method.
svm_Linear <- train(V14 ~., data = training, method = "svmLinear",
trControl=trctrl,
preProcess = c("center", "scale"),
tuneLength = 10)
The train() method should be passed with “method” parameter as “svmLinear”. We are passing our target variable V14. The “V14~.” denotes a formula for using all attributes in our classifier and V14 as the target variable. The “trControl” parameter should be passed with results from our trianControl() method. The “preProcess” parameter is for preprocessing our training data.
We are passing 2 values in our “pre-process” parameter “center” & “scale”.
These two help for centering and scaling the data.
After pre-processing, these convert our training data with mean value as approximately “0” and standard deviation as “1”. The “tuneLength” parameter holds an integer value. This is for tuning our algorithm.
You can check the result of our train() method. We are saving its results in the svm_Linear variable.
svm_Linear
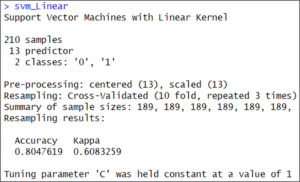
SVM linear output – Support Vector Machine In R
It’s a linear model therefore, it just tested at value “C” =1.
Now, our model is trained with C value as 1. We are ready to predict classes for our test set. We can use predict() method.
The caret package provides predict() method for predicting results. We are passing 2 arguments. Its first parameter is our trained model and second parameter “newdata” holds our testing data frame. The predict() method returns a list, we are saving it in a test_pred variable.
test_pred <- predict(svm_Linear, newdata = testing)
test_pred

Test pred output – Support Vector Machine In R
Now let’s check the accuracy of our model. We’re going to use the confusion matrix to predict the accuracy:
confusionMatrix(table(test_pred, testing$V14))
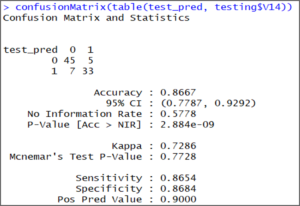
Confusion matrix output 1 – Support Vector Machine In R
The output shows that our model accuracy for test set is 86.67%.
By following the above procedure, we can build our svmLinear classifier.
We can also do some customization for selecting C value(Cost) in Linear classifier. This can be done by inputting values in grid search.
The next code snippet will show you, building & tuning of an SVM classifier with different values of C.
We are going to put some values of C using expand.grid() into “grid” dataframe. Next step is to use this dataframe for testing our classifier at specific C values. It needs to be put in train() method with tuneGrid parameter.
grid <- expand.grid(C = c(0,0.01, 0.05, 0.1, 0.25, 0.5, 0.75, 1, 1.25, 1.5, 1.75, 2,5))
svm_Linear_Grid <- train(V14 ~., data = training, method = "svmLinear",
trControl=trctrl,
preProcess = c("center", "scale"),
tuneGrid = grid,
tuneLength = 10)
svm_Linear_Grid
plot(svm_Linear_Grid)
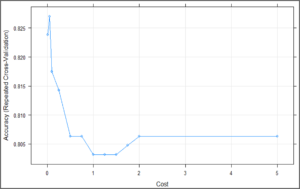
SVM Plot – Support Vector Machine In R
The above plot is showing that our classifier is giving best accuracy on C = 0.05. Let’s try to make predictions using this model for our test set.
test_pred_grid <- predict(svm_Linear_Grid, newdata = testing)
test_pred_grid
Let’s check its accuracy using confusion -matrix.
confusionMatrix(table(test_pred_grid, testing$V14))
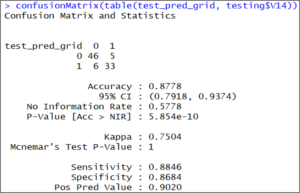
Confusion matrix 2 – Support Vector Machine In R
The results of the confusion matrix show that this time the accuracy on the test set is 87.78 %, which is more accurate than our previous result.
With this, we come to the end of this blog. I hope you found this informative and helpful, stay tuned for more tutorials on machine learning.
To get in-depth knowledge of the different machine learning algorithms along with its various applications, you can enroll in Machine Learning Course for live online training with 24/7 support and lifetime access.
Got a question for us? Mention them in the comments section.
| Course Name | Date | Details |
|---|---|---|
| Data Science Training Masters Program | Class Starts on 27th April,2024 27th April SAT&SUN (Weekend Batch) | View Details |


 REGISTER FOR FREE WEBINAR
  Thank you for registering Join Edureka Meetup community for 100+ Free Webinars each month JOIN MEETUP GROUP


Hello everyone,where can I get heart dataset please?