
Data Science with Python Certification Course
- 131k Enrolled Learners
- Weekend
- Live Class
(49300)


 Copy Link!
Understanding data and being able to create value from it is the skill of the decade. Machine Learning is one such core skill that helps companies fulfill it. However, to get started, you need to build your foundations right. So, in this article, I will cover a few basic concepts and provide you with guidelines to start your journey in Machine Learning. So, in this article on statistics for machine learning, the following topics will be discussed:
Probability and Statistics For Machine Learning:
Probability quantifies the likelihood of an event occurring. For example, if you roll a fair, unbiased die, then the probability of 1 turning up is 1/6. Now, if you are wondering why? Then the answer is quite simple!
This is because there are six possibilities and all are equally likely (fair die). Therefore we can add 1+1+1+1+1+1 = 6. But, since we are interested in the event where 1 turns up. There is only one way the event can occur. Therefore,
Probability of 1 turning up = 1/6
Similar is the case with all other numbers as all the events are equally likely. Simple, right?
Well, a frequentist definition of probability for this example would sound like – the probability of 1 turning up is the ratio of the number of times 1 turned up to the total number of times the die was rolled if the die was rolled an infinite number of times. How does this make sense?
Let’s make it more interesting. Consider the two cases – you rolled a fair die 5 times. In one case the sequence of numbers turning up is – [1,4,2,6,4,3]. In the other case, we get – [2,2,2,2,2,2]. Which one do you think is more likely?
Both are equally likely. Seems odd right?
Now, consider another case where all the 5 rolls in each case are independent. Meaning, one roll doesn’t affect the other. In the first case, when 6 turns up, it had no idea that 2 turned up before it. Hence, all 5 rolls are equally likely.
Similarly, the straight 2s in the second case can be understood as a sequence of independent events. And all these events are equally likely. Overall, since we have the same dice, the probability of a particular number turning up in case one is the same as case two. Next, in this article on statistics for machine learning, let us understand the term Independence.
Two events A and B are said to be independent if the occurrence of A does not affect event B. For example, if you toss a coin and roll a die, the outcome of the die has no effect on whether the coin shows heads or tails. Also, for two independent events A and B, the probability that A and B can occur together. So for example, if you want the probability that coin shows heads and die shows 3.
P(A and B) = P(A)*P(B)
Therefore P = ½ (probability of heads turning up) * ⅙ (probability of 3 turning up) = 1/12
In the previous example, for both the cases, P = ⅙ *⅙ *⅙ *⅙ *⅙ *⅙ .
Now let’s talk about events that are not independent. Consider the following table:
| Obese | Not Obese | |
| Heart Problems | 45 | 15 |
| No heart problems | 10 | 30 |
A survey of 100 people was taken. 60 had heart problems and 40 didn’t. Of the 60 having a heart problem, 45 were obese. Of the 40 having no heart problem, 10 were obese. If someone asks you –
The answer to the first questions is easy – 60/100. For the second one, it would be 15/100. Now consider the third question – A person was picked at random. He was found to have heart disease. What is the probability that he is obese?
Now think about the information given to you – It is known that he has heart disease. Therefore he cannot be from the 40 who don’t have heart disease. There are only 60 possible options (the top row in the table). Now, among these reduced possibilities, the probability that he is obese is 45/60. Now, that you have known, what are independent events, next in this article on statistics for machine learning, let us understand Conditional Probabilities.
To understand conditional probabilities, let’s continue our discussion with the above example. Status of being obese and the status of having suffered from heart problem is not independent. If being obese did not affect heart problems, then the number of obese and non-obese cases for people having heart problems would have been the same.
Also, we were given that the person has heart problems and we had to find out the probability that he is obese. So, the probability, in this case, is said to be conditioned on the fact that he has a heart problem. If the probability of event A occurring is conditioned on event B, we represent it as
P(A|B)
Now, there is a theorem that helps us calculate this conditional probability. It is called the Bayes Rule.
P(A|B) =P(A and B)/P(B)
You can check this theorem by plugging the example we just discussed. If you have understood so far, you can get started with the following Machine Learning Algorithm – Naive Bayes. It uses conditional probabilities to classify whether an email is a spam or not. It can perform many other classification tasks. But essentially, conditional probability is at the heart of Naive Bayes.
Statistics are used to summarize and make inferences about a large number of data points. In Data Science and Machine Learning, you will often come across the following terminology
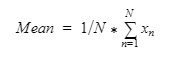
Mean is just an average of numbers. To find out mean, you have to sum the numbers and divide it with the number of numbers. For example, the mean of [1,2,3,4,5] is 15/5 = 3.
Median is the middle element of a set of numbers when they are arranged in ascending order. For example, numbers [1,2,4,3,5] are arranged in an ascending order [1,2,3,4,5]. The middle one of these is 3. Therefore the median is 3. But what if the number of numbers is even and therefore has no middle number? In that case, you take the average of the two middle-most numbers. For a sequence of 2n numbers in ascending order, average the nth and (n+1)th number to get the median. Example – [1,2,3,4,5,6] has the median (3+4)/2 = 3.5
Mode is simply the most frequent number in a set of numbers. For example, mode of [1,2,3,3,4,5,5,5] is 5.
Variance is not a centrality measure. It measures how your data is spread around the mean. It is quantified as
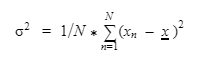
x is the mean of N numbers. You take a point, subtract the mean, take the square of this difference. Do this for all N numbers and average them. The square root of the variance is called the standard deviation. Next, in this article on statistics for machine learning, let us understand Normal Distribution.
Distribution helps us understand how our data is spread. For example, in a sample of ages, we may have young people more than older adults and hence smaller values of age more than greater values. But how do we define a distribution? Consider the example below
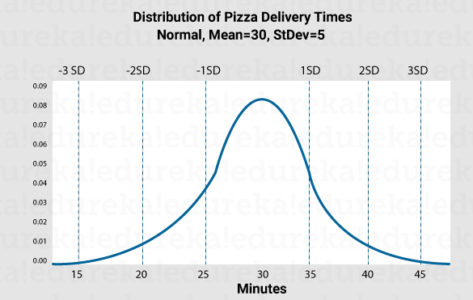
The y-axis represents the density. The mode of this distribution is 30 since it is the peak and hence most frequent. We can also locate the median. Median lies at the point on the x-axis where half of the area under the curve is covered. The area under any normal distribution is 1 because the sum of probabilities of all events is 1. For example,
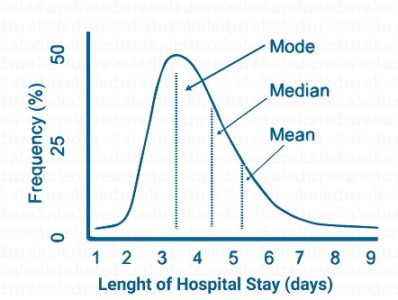
Median in the above case is around 4. This means that area under the curve before 4 is the same as that after 4. Consider another example
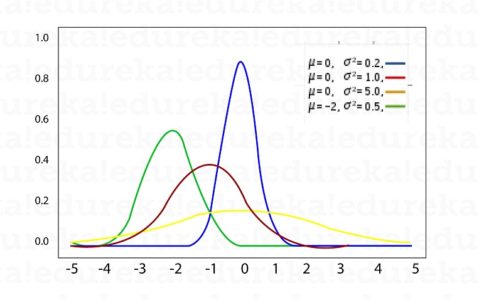
We see three normal distributions. The blue and red ones have the same mean. The red one has a greater variance. Hence, it is more spread out than the blue one. But since the area has to be 1, the peak of the red curve is shorter than the blue curve, to keep the area constant.
Hope you understood the basic statistics and normal distributions. Now, next in this article on statistics for machine learning, let us learn about Linear Algebra.
Modern AI would not be possible without Linear Algebra. It forms the core of Deep Learning and has been used even in simple algorithms like Linear Regression. Without any further delay, let’s get started.
You must be familiar with vectors. They are a kind of geometrical representations in space. For example, a vector [3,4] has 3 units along the x-axis and 4 units along the y-axis. Consider the following image –
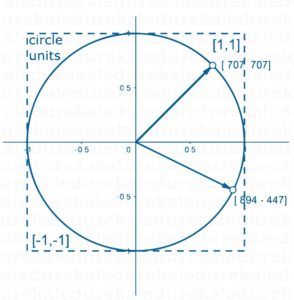
Vector d1 has 0.707 units along the x-axis and 0.707 units along the y-axis. A vector has 1 dimension. It necessarily has a magnitude and a direction. For example,
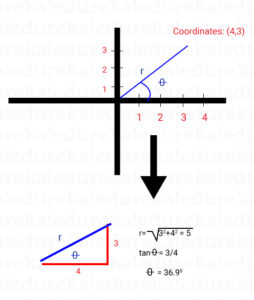
The above image has a vector (4,3). Its magnitude is 5 and it makes 36.9 degrees with the x-axis.
Now, what is a matrix? Matrix is a multi-dimensional array of numbers. What’s it used for? We’ll see ahead. But first, let’s look at how it is used.
A matrix can have many dimensions. Let’s consider a 2-dimensional matrix. It has rows (m) and columns (n). Therefore it has m*n elements.
For example,

This matrix has 5 rows and 5 columns. Let’s call it A. Therefore A(2,3) is the entry at the second row and third column which is 8.
Now, that you know what is a matrix, lets us look into the different operations of matrix.
Two matrices of the same dimensions can be added. The addition happens element-wise.

A matrix can be multiplied by a scalar quantity. Such a multiplication leads to every entry in the matrix getting multiplied by the scalar. A scalar is just a number

Matrix transpose is simple. For a matrix A(m,n), let A’ be its transpose. Then
A'(i,j) = A(j,i)
For example,

This is probably a bit tricky than other operations. Before we dive into it, let’s define dot product between two vectors.
Consider vector X = [1,4,6,0] and vector Y = [2,3,4,5]. Then dot product between X and Y is defined as
X.Y = 1*2 + 4*3 + 6*4 + 0*5 = 38
So, it is element-wise multiplication and addition. Now, let’s consider two matrices A(m,n) and B(n,k), where m,n,k are dimensions and hence integers. We define matrix multiplication as
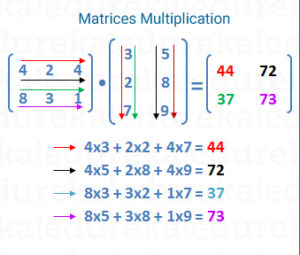
In the above example, the first element of the product (44) is obtained by the dot product of the first row of the left matrix with the first column of the right matrix. Similarly, 72 is obtained by the dot product of the first row of the left matrix with the second column of the right matrix.
Note that for the left matrix, the number of columns should be equal to the number of rows in the right column. In our case, the product AB exists but not BA since m is not equal to k. For two matrices A(m,n) and B(n,k), the product AB is defined and the dimension of the product is (m,k) (the outer most dimensions of (m,n),(n,k)). But BA is not defined unless m = k.
With this, we come to an end to this article on Statistics for Machine Learning. I hope you have some understood some of the Machine Learning Jargon. It doesn’t end here though. To make sure you are industry-ready, you can check out Edureka’s Best Machine Learning Course today.
If you’re trying to extend your business in this exciting field, check out our Artificial Intelligence Course. It is offered in collaboration with E&ICT Academy, National Institute of Technology, Warangal. This executive Masters’ Program equips students with information about the tools, techniques, and tools they require to advance their careers.


 Thank you for registering Join Edureka Meetup community for 100+ Free Webinars each month JOIN MEETUP GROUP