


Advanced Power BI Certification Course with G ...
- 12k Enrolled Learners
- Weekend
- Live Class
(4230)


 Copy Link!
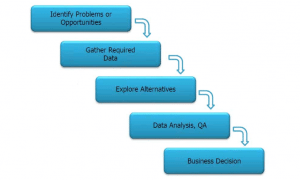
The core focus of Business Analytics is to develop new insights to business and to assess performance. There has been enough spoken about Business Analytics and its various techniques. What is required the most is a thorough understanding of how statistics is applied in Business Analytics.
Elevate your expertise by mastering the essential business analysis techniques that drive strategic decisions. Learn to analyze, innovate, and deliver solutions that propel your business forward.
Statistical Modeling is the formalization of relationships between variables in the form of mathematical equations. It is basically about finding out the variable. It describes how one or more variables are related to one or more other variables. Here, the variables are not accurately related but could be stochastically related.
In simpler terms, a variable is nothing but an attribute. An attribute becomes a person’s height, weight and age. Height and age are probabilistic in nature. A 30-year old person has higher chances of being 4 ft tall. Similarly, when you are aware of a person who is 13 years of age, he has higher chances of being 6 ft tall.
The whole purpose of statistical modeling is not about the research, it ultimately comes down to providing an insight to solutions. It involves analyzing the data and applying it in different circumstances. The topics discussed in the video are as follows:
1. What is Statistical modeling
2. What is Regression Modeling
3. Understanding Analytics
As mentioned in the above lines about statistical modeling, an important and basic factor in this theory is Regression Modeling. Regression modeling is all about sourcing the relationship between two variables. More specifically, regression helps one understand how the value of the dependent variable changes while any one of the independent variable varies, while the other independent variables are held fixed. For instance, time is an independent variable while sales and velocity are dependent on certain factors. Hence, the goal is to find out the relationship between the two.
There are certain equations in the regression model, it being the linear, multivariate and logistic regression. Logistic regression is similar to regression wherein there are two variables, therefore classifying itself as a probabilistic statistical model. It is used in describing the parameters of a qualitative response model.
In the diagram mentioned in the video, the line introduces two concepts-one which is on the line and the other which is not. The ones away from the line have an error. This is the distance between the actual value (blue dots) and the predicted value (the black line). The goal of modelling, be it in any form is to minimize these errors, which is to try and bridge the gap between the two. There are other techniques to understand the theory.
The entire operation of analytics boils down to 3 simple models- Predictive, descriptive and decision model. As the name suggests, it enables one to comprehend the future. For instance, system failure, credit worthiness, fraud come under the predictive model which is gaining world wide popularity today. On the other hand, there is descriptive and decision models that have existed for a long time. A descriptive model enables one to characterize the data, wherein, a country’s GDP and average life expectancy rate can be estimated. It is also exploratory in nature, where a customer provides the data and the problem is analyzed. The customer is given an insight to the problem and then the decision model is used after which certain optimizations are proposed. The model has a target which is nothing but optimization.
If you wish to learn Power BI and build a career in data visualization or BI, then check out our Power BI Certification Course which comes with instructor-led live training and real-life project experience. This training will help you understand Power BI in-depth and help you achieve mastery over the subject. Also, Take your career to the next level by mastering the skills required for business analysis. Enroll in our Business Analyst Certification Course today and take the first step towards a fulfilling and lucrative career.
Got a question for us? Mention them in the comments section and we will get back to you.
Related Posts:


 Thank you for registering Join Edureka Meetup community for 100+ Free Webinars each month JOIN MEETUP GROUP
Hi Team, this is my questions
1.may i know which companies support commercial hadoop with R
2.Can we integrate R with cloudera hadoop ,Hortons works platform and MapR?
Hi Hareesh! Yes, we can integrate R and Hadoop but it depends on the version you are using.
Very nice tutorial for learning.
Thanks!! Feel free to go through our posts as well.
testing process please ignore this mail
testing1
testing