
Advanced Certification in Agentic AI Engineer ...
- 68k Enrolled Learners
- Weekend
- Live Class
(45931)


 Copy Link!
Businesses generate a huge amount of data as part of their daily operations. There is a wealth of information from which the companies can derive valuable insights into the business. They can use the data to predict future events. One of the most important tools for such analysis is the spreadsheet. They use the tool for modelling and manipulating information, creating visualisations and using them to make better decisions. Companies use spreadsheets to use existing data to predict future events. Spreadsheet modelling is an excellent way to create models that help understand and interpret data.
The Executive Development Programme In General Management conducted by reputed institutions deals with spreadsheet modelling in detail. You can learn more about this course on our website.
What Is Spreadsheet Modelling And Its Use?
Spreadsheet modelling is the creation of various models using spreadsheet software like MS Excel. The software is used to organise data and apply formulas to understand the reasons for various events. Models are also used to predict events in the future. Spreadsheets are very versatile as they allow you to enter different data types and apply various formulas to arrive at a desired outcome. They automatically calculate the values as per the formula you have fed. They also allow you to visualise the outcome as charts and graphs.
There are numerous advantages to creating a model using spreadsheets. Models allow us to communicate with different people easily. They also enable us to clarify and test our understanding of various occurrences in business. Spreadsheet modelling creates credibility and accountability as everyone can see how the formulas have been applied and build trust in the outcome. These models simplify problems and help you solve them. These models are ideal for analysing data as you can feed the formula and see the results by just changing the input value. You can keep changing the values until you get the outcome you desire.
Features Of Spreadsheet Models
There are various spreadsheets that one can use for modelling. MS Excel, Google Sheets and Airtable are some popular applications used in data analysis. Almost all of them have similar features, though there may be differences in how you input data or get your results. Rows and columns in which you enter your data are common to all these applications. Some other features are also common to all software programmes used in spreadsheet modelling.
Formulas And Functions
All spreadsheets allow you to create unique formulas that will help you analyse the available data and help you get the desired outcome. Some functions and formulas are already available with the application. But you can also make a custom function and have it displayed for everyone to see what formula you have used. Experts use functions in a spreadsheet to evaluate values. Formulas help to represent the relationship between two cells in the sheet. Formulas include basic arithmetic like addition, subtraction and multiplication. Functions are represented by sum, average, count, etc.
Enabling Visualisation
Visualisation is very important in data analysis. It is not possible to show the tables and the outcome to everyone. It is also difficult for most people to understand what you have represented in the spreadsheets. One of the most important features of spreadsheet modelling is visualisation. You can show the results of your analysis using various visual aids like graphs and charts. It is possible to use various styles when presenting your graphs, like bar graphs, pie charts, etc. Spreadsheets also enable you to add different colours to make the presentation more attractive and clear.
Format The Way You Want
The biggest advantage of using applications like MS Excel for spreadsheet modelling is that they allow you to format the way you want. You can separate information and create headers. It is also possible to merge cells and make them bigger to accommodate large amounts of data without disturbing the other cells. The other advantage of spreadsheets is that you can use different colours for different cells to highlight any important information. You can also apply conditional formatting in individual cells to make them appear different. It helps you locate critical information without searching the whole sheet.
Also Read: What Are Product Management Courses? Why Are They Crucial?
Elements Of A Spreadsheet Model
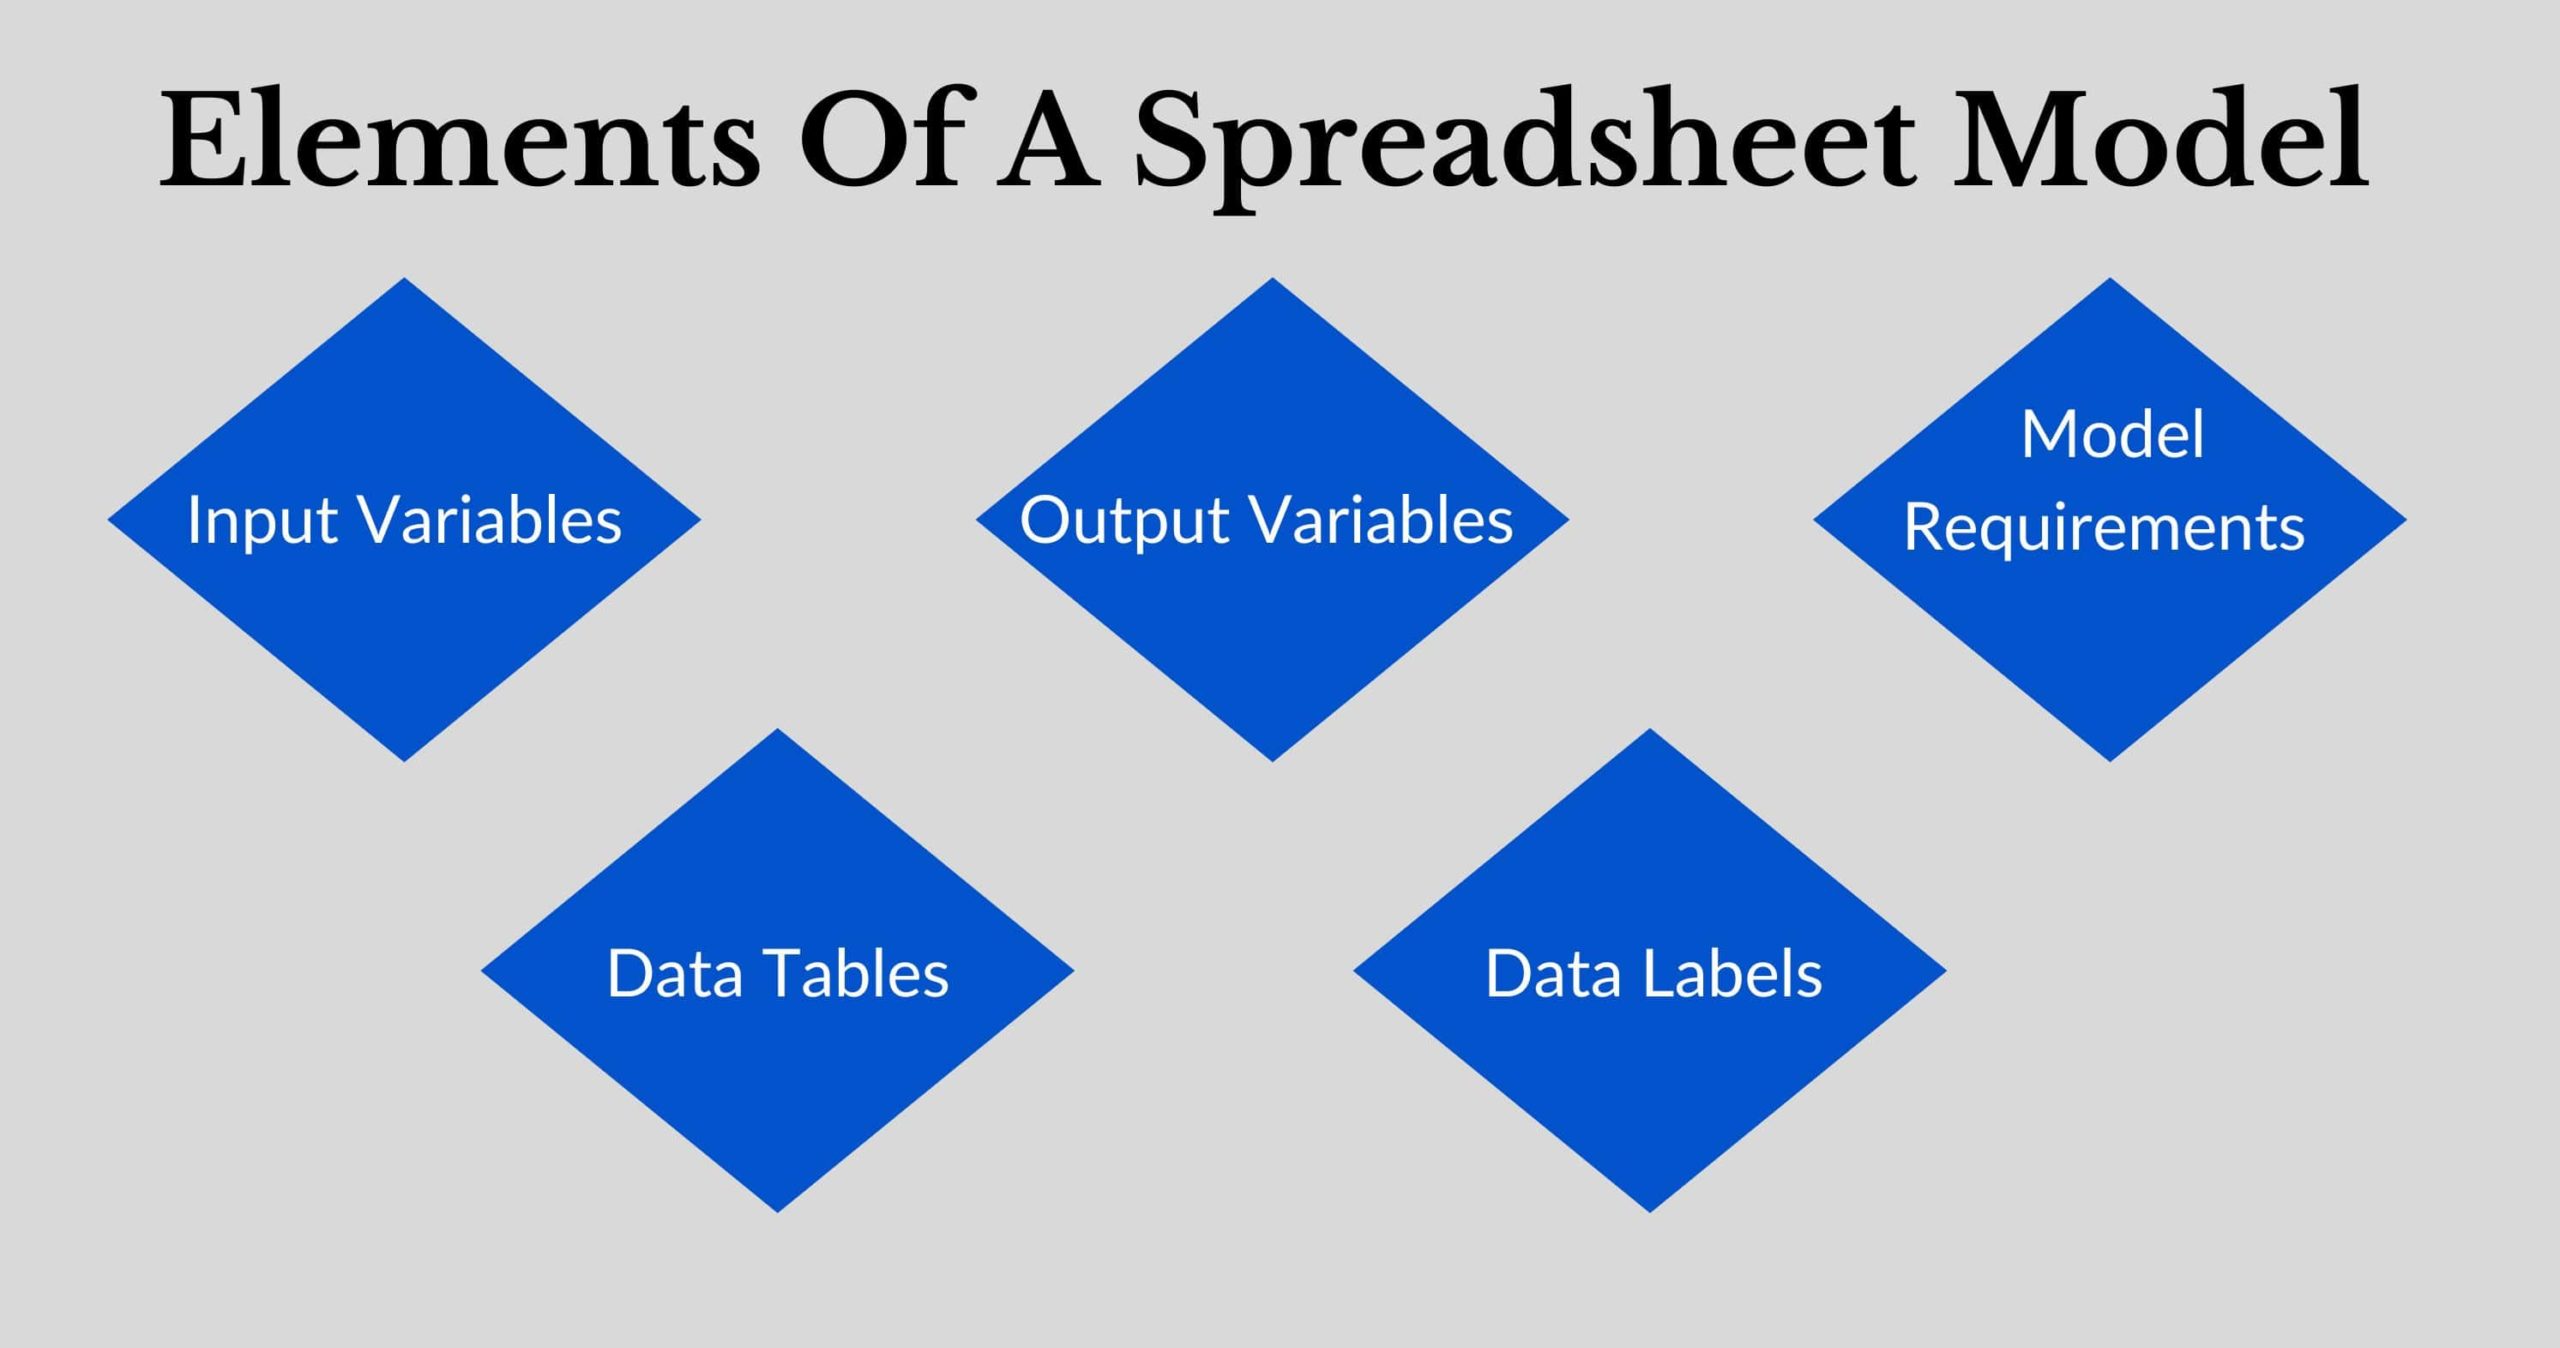 A spreadsheet model has different elements that help you display the data and make the analysis that you desire.
Input Variables – These are numerals that the analyst enters in the spreadsheet to arrive at an outcome or response. The input variables will have an impact on the output.
Output Variables – Output variables are the result of the operation in a spreadsheet. They help to know what will happen if there are changes to the input. These elements in spreadsheet modelling help companies predict the result of changes in various metrics.
Model Requirements – These are the requirements of a spreadsheet model that are necessary for generating the desired outcome.
Data Tables – These represent the changes that a firm wants to track. It could be the sales in the coming few years or the number of customers added in a certain period in the future.
Data Labels – Data labels are names that the user gives to various pieces of data to make it easy to identify a data series in the spreadsheet.
The Importance Of Spreadsheet Modelling
All businesses like to know what will happen in the future. It is especially true about the volume of sales because that is what will help organisations plan their activities in a better way. Once they know the sales that will occur in the coming few months, they can plan the purchase of raw materials accurately. There will not be any excess or shortage in the stocks of raw materials. In the same way, spreadsheet modelling helps companies predict a lot of events and make better decisions that help them cut costs and improve profitability.
You can learn a lot about creating models in spreadsheets by enrolling in the Executive Development Programme In General Management. You can learn the different types of spreadsheets used and how to create various models using them. More details about this course are available on our website.
How Do Businesses Use Spreadsheets For Data Analysis?
Modelling Of Information
Companies have a lot of information that can be valuable in making decisions that affect the future. The available data must be stored and modelled to get valuable insights into the business. Spreadsheets help to model financial, statistical or numerical data sets using rows and columns. Each item of information is stored in one cell of the rows or columns. The users can input formulas or references to other cells in each of the cells. Spreadsheet modelling includes calculations that are automatically processed when there is any change in the input.
Data Analysis
One of the main uses of spreadsheet modelling is in analysing available data to make better decisions. Companies generate a huge amount of data as part of their normal functioning. They can use this for analysing the reasons behind various events in the past, like very high or low sales. Such analysis helps the company plan better for the future. Spreadsheet applications allow users to feed custom formulas apart from already available present ones. It allows the company to manipulate the data to analyse as required. Spreadsheets also allow the user to do conditional processing of data in specific cells.
Visualise The Data
Data analysts need to show the result of their analysis to various stakeholders in the company. Everyone may not understand the way it is represented in a spreadsheet. This is why spreadsheet modelling allows the visualisation of data in various forms. One can show the existing data or the outcome as graphical displays like charts and graphs. Users can also edit these displays to their needs. Such visualisation helps the analysts to present the data in a manner that is easy for others to understand. Management teams can use such visual representations to gain valuable insights into their business.
Present The Decision
The aim of analysing data is to make better decisions. Data-based decisions are more accurate than those made using guesswork or intuition. But these decisions must be informed to others and also show the basis for such actions. Spreadsheet modelling is an excellent way to show both the present and past and explain why a decision has been made. It will help to show why a decision for the future is right. Spreadsheets also help in measuring performance. One can show the movement in sales over a particular period in a year.
Best Practices For Building Spreadsheet Models
 Consistency
Consistency is very important when you create a model. Using the same formatting style for all your models is always better. It makes your models easy to understand for others. Others can also add or delete information easily if the formatting is consistent.
Flexibility
One of the attributes that are important for spreadsheet modelling is flexibility. Making a flexible model allows us to change the formulas and see how they impact the outcome. One of the ways to improve flexibility is by only entering positive numbers so that it fits in any formula.
Transparency
A transparent model is one where there is only one calculation in one spreadsheet. It is better for an easy understanding of the information and the outcome. It is always better to have different spreadsheets for different calculations.
Accuracy
To get an accurate model is essential to feed only correct data. If there are any errors in the data, it is better to remove them to avoid more inaccuracies in the model. One of the ways to avoid errors is to create a filter that will show unique values in your spreadsheet.
Also Read: Difference Between Personnel Management And Human Resource Management
Why Are Spreadsheets Best For Data Analysis?
The main reason why spreadsheet modelling is best is that these highly flexible applications allow you to test different scenarios and know their outcome. For example, you can check the change in company profitability after increasing or decreasing staff salaries. Spreadsheets are best for analysing existing data to find future outcomes, as they allow you to test various scenarios without actually affecting your business. Let us see some of the ways you can analyse data using spreadsheets.
What If Analysis
What is analysis is one way of spreadsheet modelling that is used to find the effect of certain values on the result. By changing certain values in the spreadsheet, you can know what change it will have in the outcome. For example, if you are calculating the profit margin of a company after entering the income and expense details, you can easily see how to achieve the target profit margin. You can do this by changing the values in different rows that represent each item of income and expenditure.
As the sales of products are dependent on various external factors, the best way to increase profit margins is to reduce expenses. You can start changing the values in each expense head and see what changes it will bring to your profits. If you have a target profit margin in mind, you can change the values of expenses and find out how much you can spend the most. You can keep the sales figures as an average of the past few months to get the actual value. This type of spreadsheet modelling is known as the “what-if analysis”.
Goal Seek
In the “what if analysis” method, it will take a few tries to arrive at the correct values. You will have to keep changing each expense item to see what will give you the desired result. But if you are sure about which expense can be reduced, then it is best to use the goal-seek method for spreadsheet modelling. In this method, the idea is to find out the value in one cell that will give us the result we seek. Suppose we want to reduce salary expenses to achieve a particular profit margin, you can do so easily.
To achieve this, we need to enter the right inputs in the goal-seek dialogue box. We must give the location of the cell that contains the formula that needs solving. We must also specify the cell containing our desired profit margin. The other thing that needs to be mentioned is the cell that contains the number that can be changed. Once this is done, you must enter the desired profit margin in the To Value text box. This is an excellent spreadsheet modelling for finding out the target value for achieving a specific result.
Scenarios
This is another spreadsheet method that comes in handy in seeing how changing different values will affect the result. This is helpful when you want to find out the changes in the profit margin if you change the values of sales of different items. You can also use it to know the effect on profits if you change the inventory. Companies benefit greatly from being able to anticipate the outcome of changes in sales of different items. It helps them plan sales better and make necessary changes in production plans.
Scenarios help you find what happens if several values in a range are changed. You can simultaneously change multiple values and see what effect it has on the result. Once you have changed the values and asked for the result, you can see the changed values as well as the change in the profit margin. When you have made such changes, you will need to view them clearly in a worksheet. This is also possible by using the option to display the changes made. This type of spreadsheet modelling is ideal for seeing the result of multiple changes in a process.
The above are certain ways in which you can analyse data and get your desired outcome using spreadsheets. Let us now see the popular spreadsheet applications available for creating models.
Popular Spreadsheet Applications
MS Excel
MS Excel, by far, is the most popular spreadsheet application available today. It is used very commonly for various functions and is a favourite among data analysts. Excel offers various features, from basic mathematical calculations to highly complex automation. It is available as a desktop application or web-based software. People prefer this for spreadsheet modelling due to its versatility and ability to embed spreadsheets on the website.
Google Sheets
Google sheets is an application that comes free with all personal and business Gmail accounts. It easily integrates with other programmes like Google Analytics, Google Data Studio and Google Forms. This makes importing and exporting data very easy. One of the things that business owners like about Google Sheets is its cloud and web-based accessibility anywhere.
You can learn all the spreadsheets applications and their features in the Executive Development Programme In General Management offered by reputed institutions. You can learn all about this course on our website.
Summing Up
While there are many spreadsheet applications available for spreadsheet modelling, you must be careful in choosing the right one for your data analysis. You should look at various factors like ease of use, functionality, integrations and compatibility and the availability of real-time collaboration with other users. Free applications may not be useful if your company aims to do complete data analysis using spreadsheets. As data analysis becomes very critical for business operations, you must familiarise yourself with using spreadsheets for the purpose.
More Information:
Top 16 Supply Chain Management Interview Questions & Ans
What is IT operations management? Key Pointers
What is Order Management? A Comprehensive Guide
10 Human Resource Management Books to become a better HR