In my previous blog, I discussed the Splunk architecture, the various components and how Splunk works internally. In this blog, we will understand the relevance of knowledge objects and the role it plays in bringing operational efficiency to your business. Here, I will explain the 3 main Knowledge objects: Splunk Timechart, Data models and Alert.
Look at the below image to get an idea on how knowledge objects work.
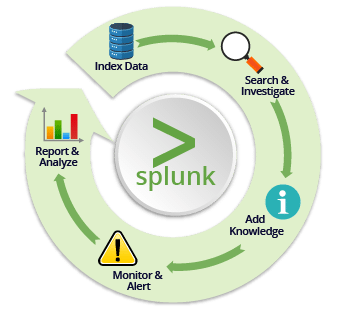
The data is first stored in an indexer and then you can write search queries and perform various operations on the data. You can set up knowledge objects to make operations smarter & to bring intelligence to your systems. These knowledge objects will monitor your events & give notifications when certain conditions occur. These results can be collated and visualized by creating reports and timecharts. Summing it up, knowledge objects are at the heart of enriching your data and creating intelligence.
Knowledge objects are user-defined entities used for extracting knowledge from existing or run-time data in order to enrich data.
So, let’s get started with the first knowledge object i.e Splunk Timechart.
Splunk Timechart
Let me explain all about Splunk Timechart and where they can be used. As an example, assume you have a large amount of data and you need to measure the number of sales and revenue generated on a monthly basis for an international apparel chain. Splunk Timechart can be used to analyze if the performance metrics (sales and revenue in this case) has had an increasing or a decreasing trend over time.
Splunk Timechart refers to visualization of any data with respect to time.
In Timechart, data is represented in the form of line, area or column charts which is plotted against x-axis that is always a time field, whereas y-axis is the variable field.
For the above example, if we had to create the Timechart for both sales and revenue numbers of an apparel chain on a monthly basis, we can plot sales and revenue on the y-axis and time on x-axis. The Splunk Timechart visualization would look like:

Splunk Timechart is often compared to Stats and Chart commands. The underlying structure between the three commands are quite different, you can refer to the table which explains the difference between them.
| Stats | Chart | Timechart |
| Stats is a reporting command which is used to present data in a tabular format. | Chart displays the data in the form of a bar, line or area graph. It also gives the capability of generating a pie chart. | Timechart allows you to look at bar and line graphs. However, pie charts are not possible. |
| In Stats command, you can use multiple fields to build a table. | In Chart, it takes only 2 fields, each field on X and Y axis respectively. | In Timechart, it takes only 1 field since the X-axis is fixed as the time field. |
Now, you know how data can be visualized using Splunk Timechart. Next, let’s learn another knowledge object- Splunk Data Models. Let me help you to understand it properly.
Splunk Data Models
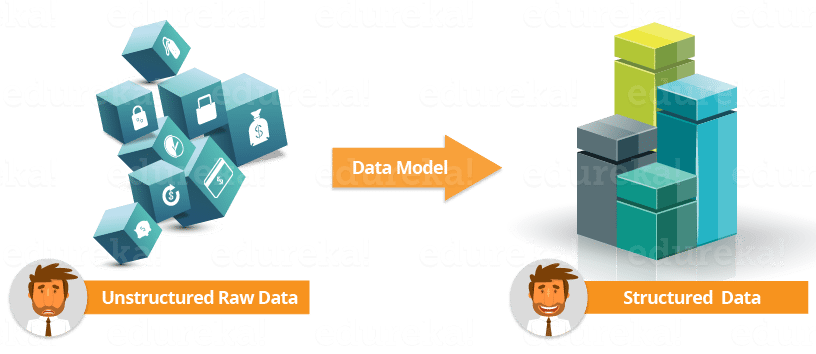
Imagine you have a large amount of unstructured data which is critical to your business, and you want an easy way out to access that information without using complex search queries. This can be done using data models as it presents your data in a sorted and hierarchical manner. The key benefits of data models are:
- It helps non-technical users to interact with data via pivot UI as they don’t have to indulge in writing complex search queries. Pivots are a representation of the dataset in the form of tables, charts or any kind of visualization. Once you create a pivot, you can save it as a report or a dashboard panel.
- Data models make it easy to re-use domain knowledge.
- As Splunk Machine Analytics is difficult to understand, Data models help in providing a structured way to map complex data.
Data models, as the name suggests, are models comprising of one or more datasets. Data models help in providing structure to your complex data and gives a broader view to understand the source, logic and domain knowledge. This can generate specialized searches based on the datasets. Data models is one of the major knowledge objects in Splunk as it combines other knowledge objects to provide a meaningful representation of your data. Data models are a combination of multiple knowledge objects such as Lookups, Event types, Field and more (refer to the below image).

I will explain each of these knowledge objects in detail in my next blog.
By now, you might have understood what data models are and how they are useful. You must be also wondering whether you can generate your own data model. The answer is yes, you can design a new data model and also edit existing models. This can be done using the Data Model Editor. However, only users who have been assigned the Admin or Power role can create data models. Other users have to first manage their permissions in order to create data models.
Let me take you through the steps involved in creating data models:
Step 1: Go to Settings-> Data Models.
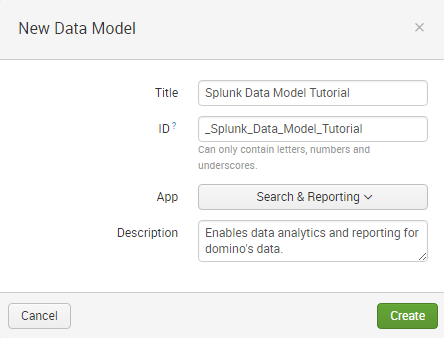
Step 2: Click ‘New Data Model’ to create a new data model.
Step 3: Specify a ‘Title’ to your data model. You can use any character in the title, except an asterisk. The data model ‘ID’ field will get filled automatically as it is a unique identifier. It can only contain letters, numbers, and underscores. Spaces between characters are not allowed.
Step 4: Choose the ‘App’ you are working on currently. By default, it will be ‘home’.
Step 5: Add a ‘Description’ to your data model.
Step 6: Click ‘Create’ and open the new data model in the Data Model Editor. Below, I have attached a screenshot that will help you understand the procedure for creating a data model:
Let us now understand how data models can be used:
Splunk Use Case
Project Statement: Create data Models to solve the Big Data challenge of Domino’s Pizza.
All of us are familiar with Domino’s Pizza. With outlets in 81 countries, it is one of the largest pizza chains in the world. First of all, do you know how they collect data in real time from several touch points? Secondly, how do they examine real-time data globally to improve their customer performance?
Data models are ideal in such a scenario since they help in organizing and managing huge data in a structured manner.
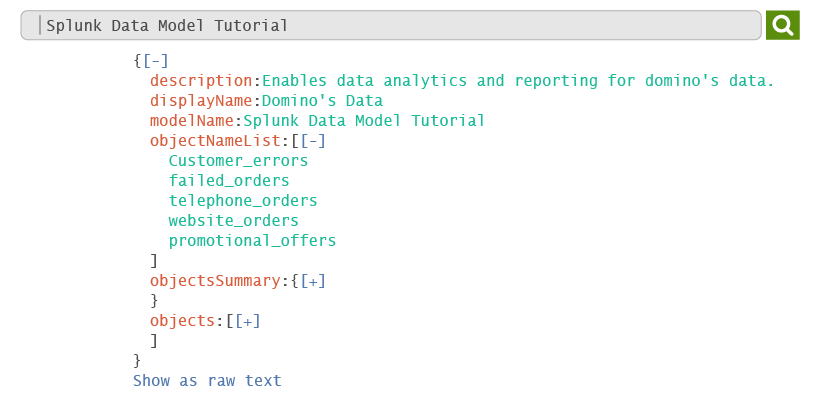
For the Domino’s example, it will return a JSON file for the “Domino’s Data” data model. It has the model ID “Splunk Data Model Tutorial”. Now, let us have a look at how data models structure the data:
*Note: The example of promotional data used is representative in nature and the data present might not be accurate.
In this example, if you send raw data to Splunk, the Data Model helps you create the structure by representing it in a JSON.
As you can see from the above image, there is an Object Name List that contains five subsets: Customer errors, failed orders, telephone orders, website orders and promotional offers.
The first subset, ‘Customer errors’ contains all the error data that customers face while processing an order.
The second subset, ‘failed order’ contains all the relevant data that deals with failed orders.
The third subset, ‘telephone order’ contains data that are processed via telephone. ‘Website orders’ will collect data ordered via domino’s website and the fifth subset ‘promotional offers’ deals with all the coupons and offers from Domino’s.
As data model divides the data into various subsets, it brings clarity to your data to help you analyze it in a hierarchical format, thereby solving Domino’s Big Data Challenge.
By now, you would have understood how data can be visualized using Splunk Timechart and managed using Data Models. Next, let me explain another knowledge object i.e Splunk Alert, and how it can be used.
Splunk Alert
Let’s consider a situation where you have a real-time application that needs to be up and running all the time. If it crashes or an error occurs during the operation, the problem needs to be identified and fixed immediately. But how will you know when something goes wrong? You cannot manually sit in front your system and monitor its state 24×7. The convenient way out would be to get notified instantly when something goes wrong. This is where Splunk Alerts can help you.
- Alerts are used to monitor your events and perform actions when pre-defined conditions occur.
- Alerts are triggered based on search results and user-defined conditions.
- Alerts use saved searches to look for events in real time or at a scheduled time.
- There is a set of alert actions that helps you get notifications about a particular event. Alert action refers to the response that occurs when an alert is triggered. Some of the main alert actions are:
- Email notifications: Send an email notification to specified recipients
- Run scripts: Invoke a custom script
- Send log events: Send log event to Splunk receiver endpoint
- Webhook: Generic HTTP POST to a specified URL.
Now that you have a basic idea of what a Splunk alert is and how it works, let me go on further and list down the different types of alerts and when they are used:

In the above image, you can see that there are two types of alerts: Scheduled alert and Real-time alert. Also, real-time alerts are further classified into per-result and rolling window alerts. Don’t worry, I will explain each one of them in detail. First, let’s start with scheduled alert:
Scheduled Alert: Suppose you belong to a retail firm and need to know the sales status at the end of every day, you can create a scheduled alert which will notify the total sales at 12 AM every day. This type of an alert can be used whenever an immediate response to an event is not required.
Real-time Alert: This type of an alert is used whenever an immediate response to an event is required. As I have mentioned earlier, real-time alerts are further classified into per-result alert and rolling window alert which are explained below:
- Per-result Alert: Let us take a scenario where a networking website admin wants to know whenever the website is down with error ‘500’. Here, the admin can choose the per-result trigger condition so that every failed attempt can be tracked.
Per-result alert type can be used when you want a notification in real-time whenever the search returns a result that matches the search condition. - Rolling window Alert: Imagine you need to create an alert which notifies if the person has 5 consecutive failed login attempts in a span of 15 minutes. This can be done using this real-time alert with rolling time window triggering. It is used to monitor the results in a specific time interval like every 30 minutes or 1 hour whenever it matches the search condition.
Now that you know the different types of alerts, you must be wondering how an alert can be created.
Problem Statement: Let’s say you want alerts every time you experience an unusually high number of server errors on a web host.
For these types of scenario, you can follow the below steps to create an alert.
Step 1: Open your Splunk Enterprise and write a search condition which you want as an alert.
In the above scenario, you can save the below search query for setting up an alert:
sourcetype=access_combined status>=500
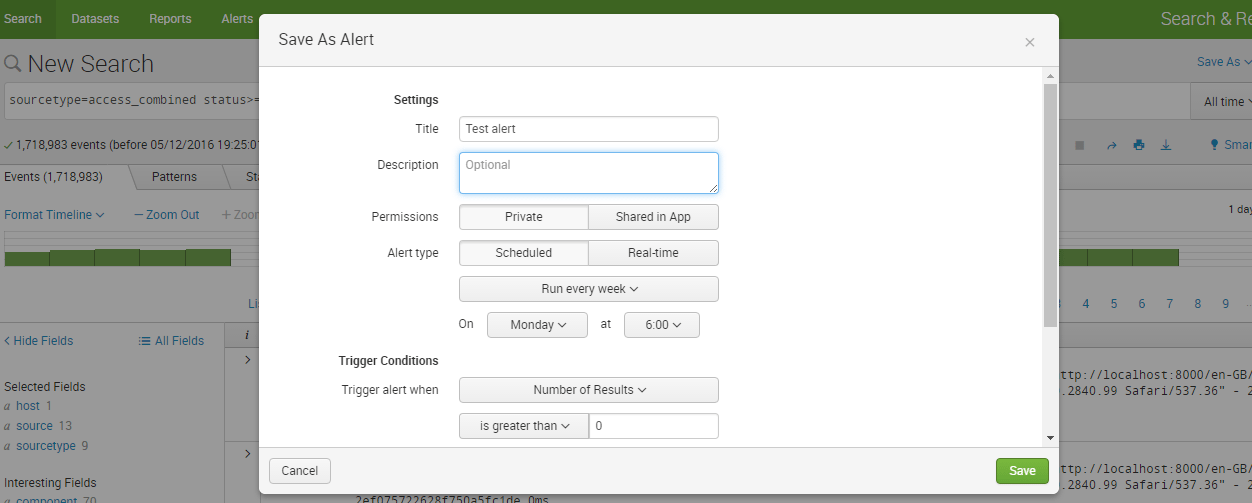
Step 2: After writing the search query, when you click on the ‘Save As’ button, you will be asked a set of questions like alert title, description, type, permission and many more.
You can use the cron schedule which simplifies this process and brings flexibility to perform the task at any point of time. It can be done by using some cron parameters corresponding to minute, hour, day of month, month and day of week. We use the cron expression to customize a schedule.
For example:
*/5**** – for every 5 minutes
*/30**** – for every 30 minutes
0 */12 *** – Every 12 hours, on the hour
0 */20 ***- Every 20 minutes, Monday through Friday.
0 9 1-7 * 1- First Monday of each month, at 9 AM.
Below, I have attached a screenshot that will help you understand the procedure for creating an alert:
In this blog, I have explained three knowledge objects which are related to notifying and visualizing data. In my next blog, I will explain a few more knowledge objects that help simplify searches such as events, event types, tags, fields, macros and lookups. Hope you enjoyed reading my first blog on knowledge objects. Stay tuned for my next blog in this series!
Do you wish to learn Splunk and implement it in your business? Check out our Splunk certification training here, that comes with instructor-led live training and real-life project experience.