


GraphX is Apache Spark’s API for graphs and graph-parallel computation. GraphX unifies ETL (Extract, Transform & Load) process, exploratory analysis and iterative graph computation within a single system. The usage of graphs can be seen in Facebook’s friends, LinkedIn’s connections, internet’s routers, relationships between galaxies and stars in astrophysics and Google’s Maps. Even though the concept of graph computation seems to be very simple, the applications of graphs is literally limitless with use cases in disaster detection, banking, stock market, banking and geographical systems just to name a few. Learning the use of this API is an important part of the Apache Spark course curriculum. Through this blog, we will learn the concepts of Spark GraphX, its features and components through examples and go through a complete use case of Flight Data Analytics using GraphX.
What are Graphs?
A Graph is a mathematical structure amounting to a set of objects in which some pairs of the objects are related in some sense. These relations can be represented using edges and vertices forming a graph. The vertices represent the objects and the edges show the various relationships between those objects.
 Figure: Spark GraphX Tutorial – Vertices, edges and triplets in graphs
In computer science, a graph is an abstract data type that is meant to implement the undirected graph and directed graph concepts from mathematics, specifically the field of graph theory. A graph data structure may also associate to each edge some edge value, such as a symbolic label or a numeric attribute (cost, capacity, length, etc.).
Use Cases of Graph Computation
The following use cases give a perspective into graph computation and further scope to implement other solutions using graphs.
- Disaster Detection System

Graphs can be used to detect disasters such as hurricanes, earthquakes, tsunami, forest fires and volcanoes so as to provide warnings to alert people.
- Page Rank Page Rank can be used in finding the influencers in any network such as paper-citation network or social media network.
- Financial Fraud Detection
Graph analysis can be used to monitor financial transaction and detect people involved in financial fraud and money laundering.
- Business Analysis
Graphs, when used along with Machine Learning, helps in understanding the customer purchase trends. E.g. Uber, McDonald’s, etc.
- Geographic Information Systems
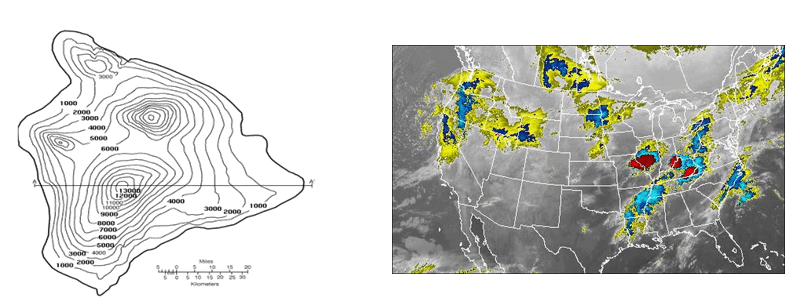
Graphs are intensively used to develop functionalities on geographic information systems like watershed delineation and weather prediction.
- Google Pregel
Pregel is Google’s scalable and fault-tolerant platform with an API that is sufficiently flexible to express arbitrary graph algorithms.


What is Spark GraphX?
GraphX is the Spark API for graphs and graph-parallel computation. It includes a growing collection of graph algorithms and builders to simplify graph analytics tasks.

GraphX extends the Spark RDD with a Resilient Distributed Property Graph. The property graph is a directed multigraph which can have multiple edges in parallel. Every edge and vertex have user defined properties associated with it. The parallel edges allow multiple relationships between the same vertices.
Spark GraphX Features
The following are the features of Spark GraphX:
- Flexibility:
Spark GraphX works with both graphs and computations. GraphX unifies ETL (Extract, Transform & Load), exploratory analysis and iterative graph computation within a single system. We can view the same data as both graphs and collections, transform and join graphs with RDDs efficiently and write custom iterative graph algorithms using the Pregel API. - Speed:
Spark GraphX provides comparable performance to the fastest specialized graph processing systems. It is comparable with the fastest graph systems while retaining Spark’s flexibility, fault tolerance and ease of use. - Growing Algorithm Library:
We can choose from a growing library of graph algorithms that Spark GraphX has to offer. Some of the popular algorithms are page rank, connected components, label propagation, SVD++, strongly connected components and triangle count.
Understanding GraphX with Examples
We will now understand the concepts of Spark GraphX using an example. Let us consider a simple graph as shown in the image below.
 Figure: Spark GraphX Tutorial – Graph Example
Looking at the graph, we can extract information about the people (vertices) and the relations between them (edges). The graph here represents the Twitter users and whom they follow on Twitter. For e.g. Bob follows Davide and Alice on Twitter.
Let us implement the same using Apache Spark. First, we will import the necessary classes for GraphX.
//Importing the necessary classes
import org.apache.spark._
import org.apache.spark.rdd.RDD
import org.apache.spark.util.IntParam
import org.apache.spark.graphx._
import org.apache.spark.graphx.util.GraphGenerators
Displaying Vertices: Further, we will now display all the names and ages of the users (vertices).
val vertexRDD: RDD[(Long, (String, Int))] = sc.parallelize(vertexArray)
val edgeRDD: RDD[Edge[Int]] = sc.parallelize(edgeArray)
val graph: Graph[(String, Int), Int] = Graph(vertexRDD, edgeRDD)
graph.vertices.filter { case (id, (name, age)) => age > 30 }
.collect.foreach { case (id, (name, age)) => println(s"$name is $age")}
The output for the above code is as below:
David is 42
Fran is 50
Ed is 55
Charlie is 65
Displaying Edges: Let us look at which person likes whom on Twitter.
for (triplet <- graph.triplets.collect)
{
println(s"${triplet.srcAttr._1} likes ${triplet.dstAttr._1}")
}
The output for the above code is as below:
Bob likes Alice
Bob likes David
Charlie likes Bob
Charlie likes Fran
David likes Alice
Ed likes Bob
Ed likes Charlie
Ed likes Fran
Now that we have understood the basics of GraphX, let us dive a bit deeper and perform some advanced computations on the same.
Number of followers: Every user in our graph has a different number of followers. Let us look at all the followers for every user.
// Defining a class to more clearly model the user property
case class User(name: String, age: Int, inDeg: Int, outDeg: Int)
// Creating a user Graph
val initialUserGraph: Graph[User, Int] = graph.mapVertices{ case (id, (name, age)) => User(name, age, 0, 0) }

// Filling in the degree information
val userGraph = initialUserGraph.outerJoinVertices(initialUserGraph.inDegrees) {
case (id, u, inDegOpt) => User(u.name, u.age, inDegOpt.getOrElse(0), u.outDeg)
}.outerJoinVertices(initialUserGraph.outDegrees) {
case (id, u, outDegOpt) => User(u.name, u.age, u.inDeg, outDegOpt.getOrElse(0))
}
for ((id, property) <- userGraph.vertices.collect) {
println(s"User $id is called ${property.name} and is liked by ${property.inDeg} people.")
}
The output for the above code is as below:
User 1 is called Alice and is liked by 2 people.
User 2 is called Bob and is liked by 2 people.
User 3 is called Charlie and is liked by 1 people.
User 4 is called David and is liked by 1 people.
User 5 is called Ed and is liked by 0 people.
User 6 is called Fran and is liked by 2 people.
Oldest Followers: We can also sort the followers by their characteristics. Let us find the oldest followers of each user by age.
// Finding the oldest follower for each user
val oldestFollower: VertexRDD[(String, Int)] = userGraph.mapReduceTriplets[(String, Int)](
// For each edge send a message to the destination vertex with the attribute of the source vertex
 edge => Iterator((edge.dstId, (edge.srcAttr.name, edge.srcAttr.age))),
 // To combine messages take the message for the older follower
 (a, b) => if (a._2 > b._2) a else b
 )
The output for the above code is as below:
David is the oldest follower of Alice.
Charlie is the oldest follower of Bob.
Ed is the oldest follower of Charlie.
Bob is the oldest follower of David.
Ed does not have any followers.
Charlie is the oldest follower of Fran.
Use Case: Flight Data Analysis using Spark GraphX
Now that we have understood the core concepts of Spark GraphX, let us solve a real-life problem using GraphX. This will help give us the confidence to work on any Spark projects in the future.
Problem Statement: To analyze Real-Time Flight data using Spark GraphX, provide near real-time computation results and visualize the results using Google Data Studio.
Use Case – Computations to be done:
- Compute the total number of flight routes
- Compute and sort the longest flight routes
- Display the airport with the highest degree vertex
- List the most important airports according to PageRank
- List the routes with the lowest flight costs
We will use Spark GraphX for the above computations and visualize the results using Google Data Studio.
Use Case – Dataset:
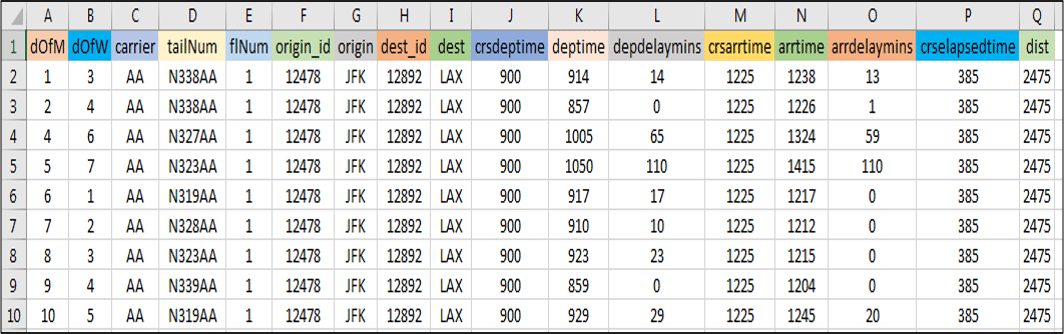 Figure: Use Case – USA Flight Dataset
Use Case – Flow Diagram:
The following illustration clearly explains all the steps involved in our Flight Data Analysis.
 Figure: Use Case – Flow diagram of Flight Data Analysis using Spark GraphX
Use Case – Spark Implementation:
Moving ahead, now let us implement our project using Eclipse IDE for Spark.
Find the Pseudo Code below:
//Importing the necessary classes
import org.apache.spark._
...
import java.io.File

object airport {

 def main(args: Array[String]){

//Creating a Case Class Flight
case class Flight(dofM:String, dofW:String, ... ,dist:Int)

//Defining a Parse String function to parse input into Flight class
def parseFlight(str: String): Flight = {
val line = str.split(",")
Flight(line(0), line(1), ... , line(16).toInt)
}
val conf = new SparkConf().setAppName("airport").setMaster("local[2]")
val sc = new SparkContext(conf)
//Load the data into a RDD

val textRDD = sc.textFile("/home/edureka/usecases/airport/airportdataset.csv")

//Parse the RDD of CSV lines into an RDD of flight classes
val flightsRDD = Map ParseFlight to Text RDD

//Create airports RDD with ID and Name
val airports = Map Flight OriginID and Origin
airports.take(1)

//Defining a default vertex called nowhere and mapping Airport ID for printlns
val nowhere = "nowhere"
val airportMap = Use Map Function .collect.toList.toMap

//Create routes RDD with sourceID, destinationID and distance
val routes = flightsRDD. Use Map Function .distinct
routes.take(2)

//Create edges RDD with sourceID, destinationID and distance
val edges = routes.map{( Map OriginID and DestinationID ) => Edge(org_id.toLong, dest_id.toLong, distance)}
edges.take(1)

//Define the graph and display some vertices and edges
val graph = Graph( Airports, Edges and Nowhere )
graph.vertices.take(2)
graph.edges.take(2)

//Query 1 - Find the total number of airports
val numairports = Vertices Number

//Query 2 - Calculate the total number of routes?
val numroutes = Number Of Edges

//Query 3 - Calculate those routes with distances more than 1000 miles
graph.edges.filter { Get the edge distance )=> distance > 1000}.take(3)

//Similarly write Scala code for the below queries
//Query 4 - Sort and print the longest routes
//Query 5 - Display highest degree vertices for incoming and outgoing flights of airports
//Query 6 - Get the airport name with IDs 10397 and 12478
//Query 7 - Find the airport with the highest incoming flights
//Query 8 - Find the airport with the highest outgoing flights
//Query 9 - Find the most important airports according to PageRank
//Query 10 - Sort the airports by ranking
//Query 11 - Display the most important airports
//Query 12 - Find the Routes with the lowest flight costs
//Query 13 - Find airports and their lowest flight costs
//Query 14 - Display airport codes along with sorted lowest flight costs
Redefine your data analytics workflow and unleash the true potential of big data with Pyspark Training.
Use Case – Visualizing Results:
We will be using Google Data Studio to visualize our analysis. Google Data Studio is a product under Google Analytics 360 Suite. We will use Geo Map service to map the Airports on their respective locations on the USA map and display the metrics quantity.
- Display the total number of flights per Airport
- Display the metric sum of Destination routes from every Airport
- Display the total delay of all flights per Airport
Now, this concludes the Spark GraphX blog. I hope you enjoyed reading it and found it informative. Do check out the next blog in our Apache Spark series on Spark Interview Questions to become market ready in Apache Spark.
We recommend the following Apache Spark Training | Flight Data Analysis video from Edureka to begin with:
Apache Spark Training | Spark GraphX Flight Data Analysis | Edureka
Got a question for us? Please mention it in the comments section and we will get back to you at the earliest.
If you wish to learn Spark and build a career in domain of Spark and build expertise to perform large-scale Data Processing using RDD, Spark Streaming, SparkSQL, MLlib, GraphX and Scala with Real Life use-cases, check out our interactive, live-online Apache Spark Certification Training here, that comes with 24*7 support to guide you throughout your learning period.Upskill your data engineering skills with our Microsoft fabric certification Training course


This is very good for beginners. In the Twitter sample, it seems your didn’t create vertexArray and EdgeArray first. Please update your codes. In addition, please provide a link of the Twitter sample data. Thanks.
Marco