Python Scripting Certification Training
- 15k Enrolled Learners
- Weekend
- Self Paced
(5900)


 Copy Link!
In this blog, we will be discussing Scikit learn in python. Before talking about Scikit learn, one must understand the concept of machine learning and must know how to use Python for Data Science. With machine learning, you don’t have to gather your insights manually. You just need an algorithm and the machine will do the rest for you! Isn’t this exciting? Scikit learn is one of the attraction where we can implement machine learning using Python. It is a free machine learning library which contains simple and efficient tools for data analysis and mining purposes. I will take you through the following topics, which will serve as fundamentals for the upcoming blogs:
🐍 Ready to Unleash the Power of Python? Sign Up for Edureka’s Comprehensive Python Training Online with access to hundreds of Python learning Modules and 24/7 technical support.
Machine learning is a type of artificial intelligence that allows software applications to learn from the data and become more accurate in predicting outcomes without human intervention. But how does that happen? For that, the machine needs to be trained on some data and based on that, it will detect a pattern to create a model. This process of gaining knowledge from the data and providing powerful insights is all about machine learning. Refer the below image to get a better understanding of its working:
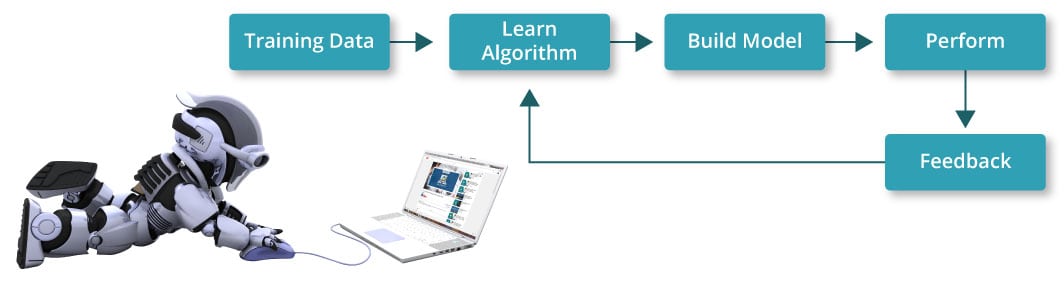
Using the data, the system learns an algorithm and then uses it to build a predictive model. Later on, we adjust the model or we enhance the accuracy of the model using the feedback data. Using this feedback data, we tune the model and predict action on the new data set. We will be discussing a use case of one of the algorithm approach where we will train and test the data which will help you give a better sense of whether it will be a good fit for your particular problem or not.
Transform yourself into a highly skilled professional and land a high-paying job with the Artificial Intelligence Course.
Next, there are three types of machine learning:
Scikit learn is a library used to perform machine learning in Python. Scikit learn is an open source library which is licensed under BSD and is reusable in various contexts, encouraging academic and commercial use. It provides a range of supervised and unsupervised learning algorithms in Python. Scikit learn consists popular algorithms and libraries. Apart from that, it also contains the following packages:
To implement Scikit learn, we first need to import the above packages. If you are not familiar with these libraries, you can have a look at my previous blogs on Numpy and Matplotlib. You can download these two packages using the command line or if you are using PyCharm, you can directly install it by going to your setting in the same way you do it for other packages.
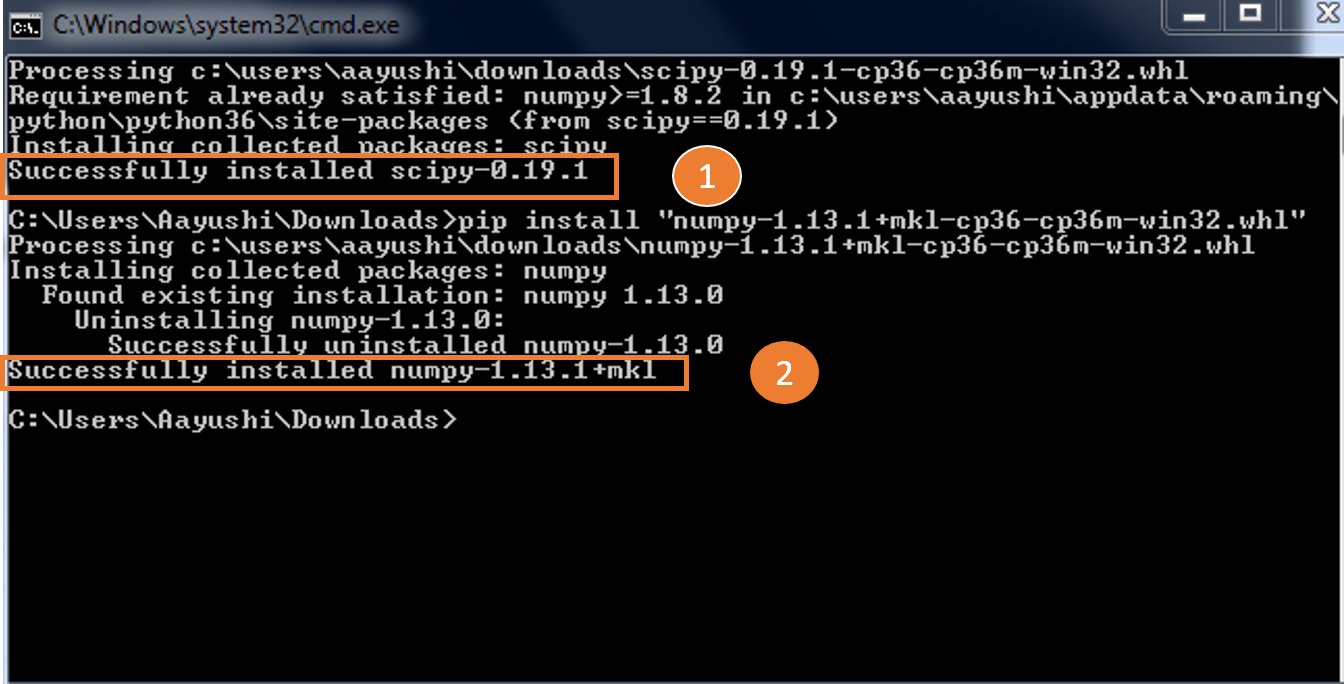
Next, in a similar manner, you have to import Sklearn. Scikit learn is built upon the SciPy (Scientific Python) that must be installed before you can use Scikit-learn. Also, install Scipy and wheel package if it’s not present, you can type in the below command:
pip install scipyI have already downloaded and installed it, you can refer to the below screenshot for any confusion.
After importing the above libraries, let’s dig deeper and understand how exactly Scikit learn is used.
Scikit learn comes with sample datasets, such as iris and digits. You can import the datasets and play around with them. After that, you have to import SVM which stands for Support Vector Machine. SVM is a form of machine learning which is used to analyze data.
Let us take an example where we will take digits dataset and it will categorize the numbers for us, for example- 0 1 2 3 4 5 6 7 8 9. Refer to the code below:
import matplotlib.pyplot as plt
from sklearn import datasets
from sklearn import svm

digits= datasets.load_digits()
print(digits.data)
Output –
[[ 0. 0. 5. ..., 0. 0. 0.]
 [ 0. 0. 0. ..., 10. 0. 0.]
 [ 0. 0. 0. ..., 16. 9. 0.]
 ...,
 [ 0. 0. 1. ..., 6. 0. 0.]
 [ 0. 0. 2. ..., 12. 0. 0.]
 [ 0. 0. 10. ..., 12. 1. 0.]]
Here we have just imported the libraries, SVM, datasets and printed the data. It’s a long array of digits data where the data is stored. It gives the access to the features that can be used to classify the digits samples. Next, you can also try some other operations such as target, images etc. Consider the example below:
import matplotlib.pyplot as plt
from sklearn import datasets
from sklearn import svm

digits= datasets.load_digits()
print(digits.target)
print(digits.images[0])
Output –
 [0 1 2 ..., 8 9 8]                  // target of the data
[[ 0. 0. 5. 13. 9. 1. 0. 0.]         // image of the data
 [ 0. 0. 13. 15. 10. 15. 5. 0.]
 [ 0. 3. 15. 2. 0. 11. 8. 0.]
 [ 0. 4. 12. 0. 0. 8. 8. 0.]
 [ 0. 5. 8. 0. 0. 9. 8. 0.]
 [ 0. 4. 11. 0. 1. 12. 7. 0.]
 [ 0. 2. 14. 5. 10. 12. 0. 0.]
 [ 0. 0. 6. 13. 10. 0. 0. 0.]]
As you can see above, the target digits and the image of the digits are printed. digits.target gives the ground truth for the digit dataset, that is the number corresponding to each digit image. Next, data is always a 2D array which has a shape (n_samples, n_features), although the original data may have had a different shape. But in the case of the digits, each original sample is an image of shape (8,8) and can be accessed using digits.image.
Learning and Predicting
Next, in Scikit learn, we have used a dataset (sample of 10 possible classes, digits from zero to nine) and we need to predict the digits when an image is given. To predict the class, we need an estimator which helps to predict the classes to which unseen samples belong. In Scikit learn, we have an estimator for classification which is a python object that implements the methods fit(x,y) and predict(T). Let’s consider the below example:
import matplotlib.pyplot as plt
from sklearn import datasets
from sklearn import svm

digits= datasets.load_digits()                     // dataset
clf = svm.SVC(gamma=0.001, C=100)
print(len(digits.data))
x,y=digits.data[:-1],digits.target[:-1]            // train the data
clf.fit(x,y)
print('Prediction:', clf.predict(digits.data[-1])) //predict the data
plt.imshow(digits.images[-1],cmap=plt.cm.gray_r, interpolation="nearest")
plt.show()
Output –
1796
Prediction: [8]
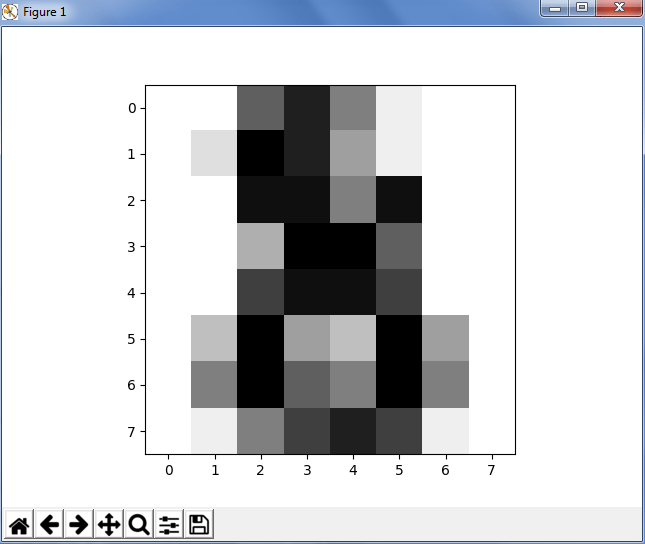
In the above example, we had first found the length and loaded 1796 examples. Next, we have used this data as a learning data, where we need to test the last element and first negative element. Also, we need to check whether the machine has predicted the right data or not. For that, we had used Matplotlib where we had displayed the image of digits. So to conclude, you have digits data, you got the target, you fit and predict it and hence you’re good to go! It’s really quick and easy, isn’t it?
You can also visualize the target labels with an image, just refer to the below code:
import matplotlib.pyplot as plt
from sklearn import datasets
from sklearn import svm

digits= datasets.load_digits()
# Join the images and target labels in a list
images_and_labels = list(zip(digits.images, digits.target))

# for every element in the list
for index, (image, label) in enumerate(images_and_labels[:8]):
    # initialize a subplot of 2X4 at the i+1-th position
    plt.subplot(2, 4, index + 1)
    # Display images in all subplots
    plt.imshow(image, cmap=plt.cm.gray_r,interpolation='nearest')
    # Add a title to each subplot
    plt.title('Training: ' + str(label))

# Show the plot
plt.show()
Output –
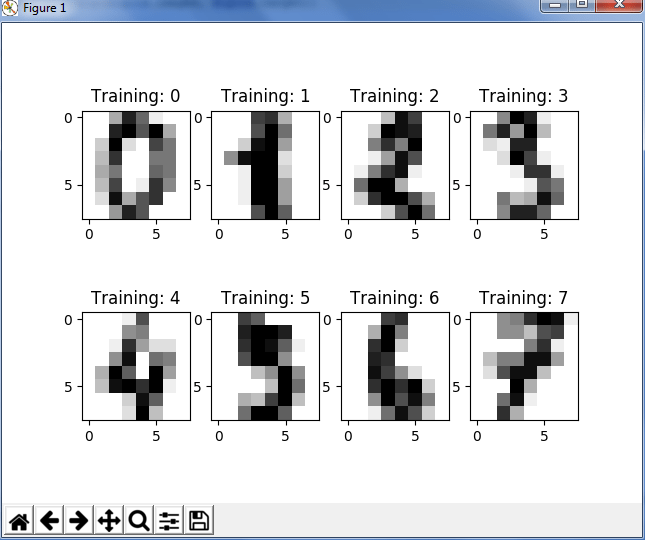
As you can see in the above code, we have used the ‘zip’ function to join the images and target labels in a list and then save it into a variable, say images_and_labels. After that, we have indexed the first eight elements in a grid of 2 by 4 at each position. After that, we have just displayed the images with the help of Matplotlib and added the title as ‘training’.
Problem Statement – A car company has released a new SUV in the market. Using the previous data about the sales of their SUV’s, they want to predict the category of people who might be interested in buying this.
For this, let us see a dataset where I have UserId, gender, age, estimated salary and purchased as columns. This is just a sample dataset, you can download the entire dataset from here. Once we import the data in pyCharm, it looks somewhat like this.
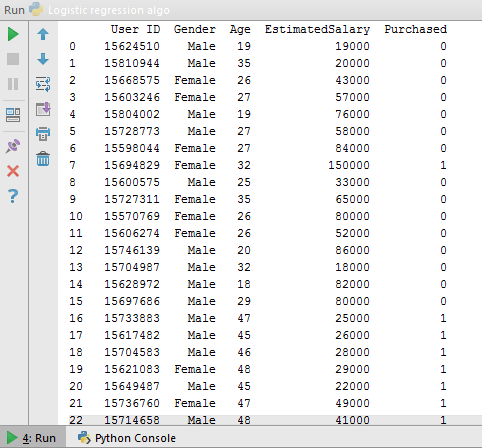
Now let us understand this data. As you can see in the above dataset, we have categories such as id, gender, age etc. Now based on these categories, we are going to train our machine and predict the no. of purchases. So here, we have independent variables as ‘age’, ‘expected salary’ and dependent variable as ‘purchased’. Now we will apply supervised learning, i.e logistic regression algorithm to find out the number of purchase using the existing data.
First, let’s get an overview of logistic regression.
Logistic Regression – Logistic Regression produces results in a binary format which is used to predict the outcome of a categorical dependent variable. It is most widely used when the dependent variable is binary i.e, the number of available categories is two such as, the usual outputs of logistic regression are –
Now to begin with the code, we will first import these libraries – Numpy, Matplotlib and Pandas. It is pretty easy to import pandas in Pycharm by following the below steps:
Settings -> Add Package -> Pandas -> Install After this, we will import the dataset and separate dependent variable(purchased) and independent variable(age, salary) by:
dataset = pd.read_csv('Social_Network_Ads.csv')
X = dataset.iloc[:, [2, 3]].values
y = dataset.iloc[:, 4].values
print(X)
print(y)
The next step would be training and test the data. A common strategy is to take all the labelled data and split into training and testing subsets, which is usually taken with a ratio of 70-80% for training subset and 20-30% for the testing subset. Hence, we have created create Training and Testing sets using cross_validation.
from sklearn.cross_validation import train_test_split

X_train, X_test, y_train, y_test = train_test_split(X, y, test_size = 0.25, random_state = 0)
We can also scale the input values for better performance using StandarScaler as shown below:
from sklearn.preprocessing import StandardScaler

sc = StandardScaler()

X_train = sc.fit_transform(X_train)

X_test = sc.transform(X_test)
Now we will create our Logistic Regression model.
from sklearn.linear_model import LogisticRegression

classifier = LogisticRegression(random_state = 0)

classifier.fit(X_train, y_train)
We can use this and predict the results of our test set.
y_pred = classifier.predict(X_test)
Now, we can check how many predictions were accurate and how many were not using confusion matrix. Let us define Y as positive instances and N as negative instances. The four outcomes are formulated in 2*2 confusion matrix, as represented below: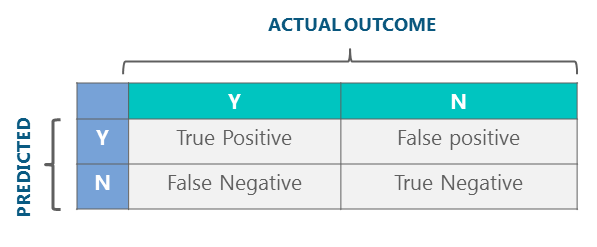
from sklearn.metrics import confusion_matrix

cm = confusion_matrix(y_test, y_pred)

print(cm)
Output –
[[65 3]
 [ 8 24]]
Next, based on our confusion matrix, we can calculate the accuracy. So in our above example, the accuracy would be:
= TP + TN / FN + FP
= 65+24 / 65 +3+ 8 + 24
=89%
We have done this manually! Now let us see how machine calculates the same for us, for that we have an inbuilt function ‘accuracy_score’ which calculates the accuracy and prints it, as shown below:
from sklearn.metrics import accuracy_score    // import the function accuracy_score

print(accuracy_score(y_test, y_pred)*100)     // prints the accuracy
Output –
89.0
Hurray! We have thus successfully implemented logistic regression using Scikit learn with an accuracy of 89%.
Click here to get the full complete source of the above prediction using Python Scikit learn library.
With this, we have covered just one of the many popular algorithms python has to offer. We have covered all the basics of Scikit learn the library, so you can start practicing now. The more you practice the more you will learn. Stay tuned for further python tutorial blogs!
Got a question for us? Please mention it in the comments section of this “Scikit learn”blog and we will get back to you as soon as possible. To get in-depth knowledge of Python along with its various applications, you can enroll now for live Machine Learning course online with 24/7 support and lifetime access.


 Thank you for registering Join Edureka Meetup community for 100+ Free Webinars each month JOIN MEETUP GROUP
Gracias…. Muy Interesante